Ruby Error and Performance Monitoring
Ruby Actionable insights to resolve Ruby performance bottlenecks and errors. Improve your Ruby monitoring workflow with a full view of releases so you can mark errors as resolved and prioritize live issues.
Getting Started is Simple
Add the sentry-ruby gem to your Gemfile:
gem "sentry-ruby"
Configure your DSN:
Sentry.init do |config|
  config.dsn = 'https://<key>@sentry.io/<project>'

  # Set a uniform sample rate between 0.0 and 1.0
  # We recommend adjusting the value in production:
  config.traces_sample_rate = 1.0

  # or control sampling dynamically
  config.traces_sampler = lambda do |sampling_context|
    # sampling_context[:transaction_context] contains the information about the transaction
    # sampling_context[:parent_sampled] contains the transaction's parent's sample decision
    true # return value can be a boolean or a float between 0.0 and 1.0
  end
end
Check our documentation for the latest instructions.
See all platformsHow to install the Ruby SDK

Ruby Performance Monitoring
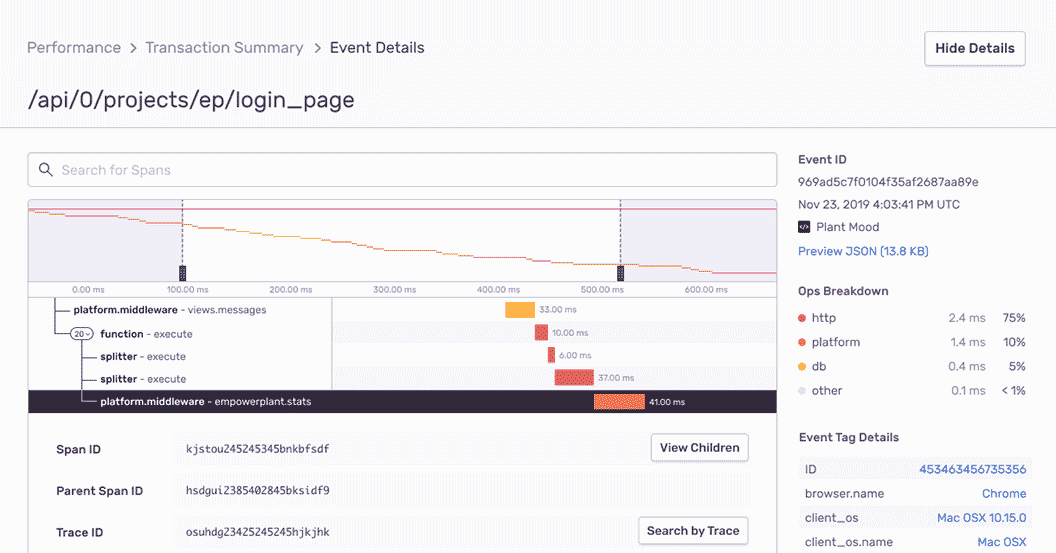
Quickly identify Ruby performance issues and view full end-to-end distributed trace to see the exact, poor-performing API call and surface any related errors.

Ruby Monitoring with Complete Stack Traces
Take advantage of built-in integrations with Rails, Sidekiq, DelayedJob, and more of your favorite RubyGems. Enable asynchronous reporting so errors are logged quickly in a background job. Filter and group Ruby exceptions intuitively to eliminate noise.

Fill In The Blanks About Ruby Errors
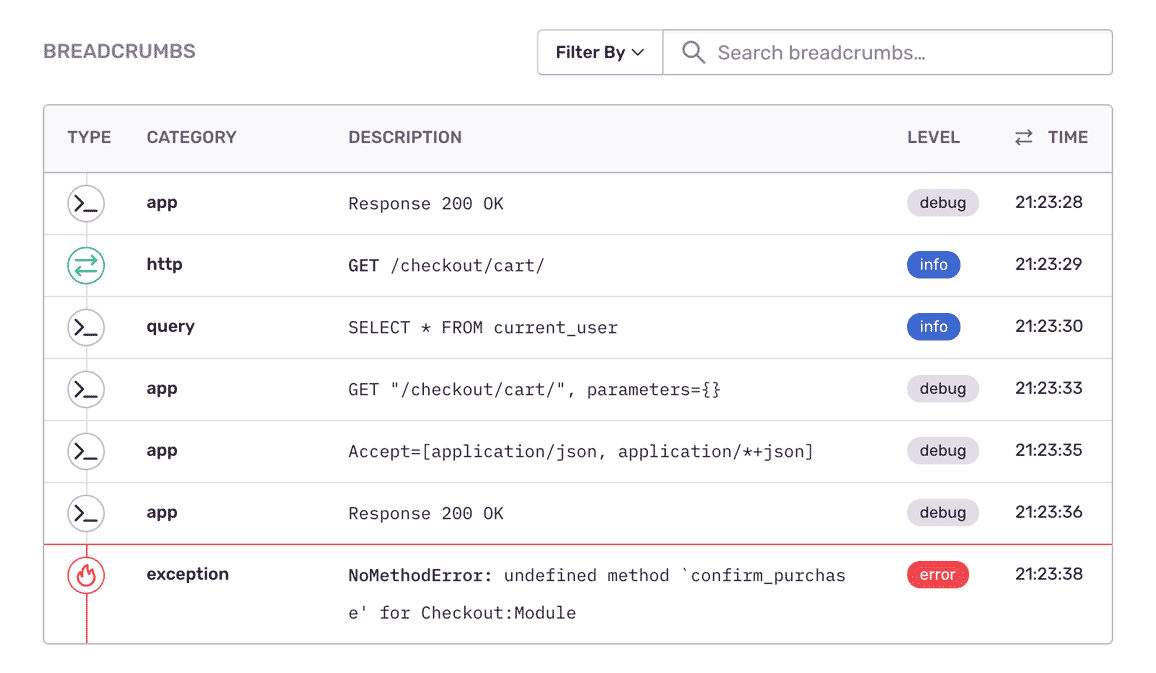
Expose important events that led to each Ruby exception: a string to label where the event took place, message, timestamp. Learn in which version a bug first appeared, merge duplicates, and know if things regress in a future release.
“Sentry has become mission-critical to the way we build and ship software.”
See the Full Picture of Any Ruby Exception
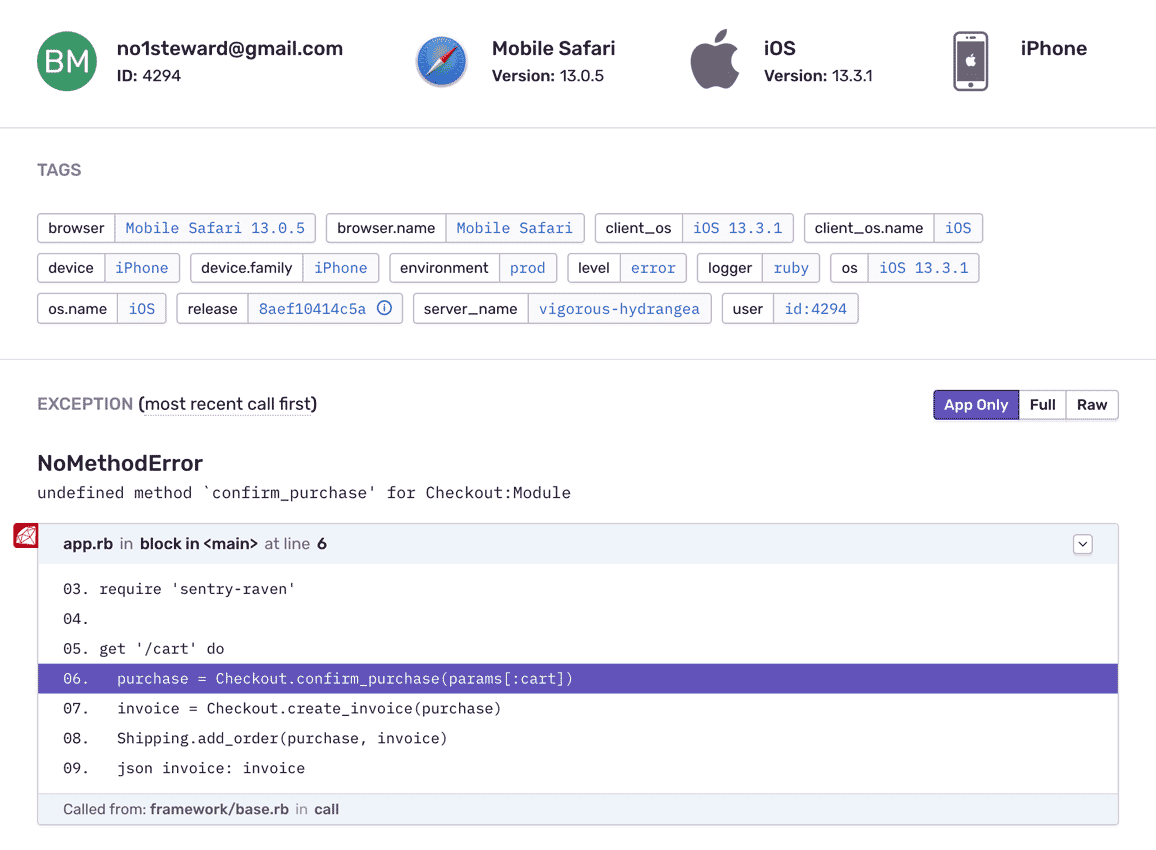
Get the user’s unique id, contact info, and IP address, as well as any localization as context to resolve the error and notify your customer.
Index and aggregate tags to easily search your error reports, see the distribution of issues, and find what’s a priority or a trend.
Find answers to key questions: Is the Ruby exception limited to a single server? What arguments caused the ActiveJob to fail?
It’s why companies that don’t have a complete view of their infrastructure are being punished:
The average cost of network downtime is around $5,600 per minute — or $300,000 per hour.
1 out of 5 online shoppers will abandon their cart because the transaction process was too slow.
On average, a two-second slowdown in page load decreases revenues by 4.3 percent.