PHP Error Monitoring
Actionable insights to resolve PHP performance bottlenecks and errors. See the full picture of any PHP exception with a clear workflow to create an efficient PHP debugging process.
Getting Started is Simple
Install the sentry/sentry package with Composer:
composer require sentry/sentry
To capture all errors, even the one during the startup of your application, you should initialize the Sentry PHP SDK as soon as possible.
\Sentry\init(['dsn' => 'https://<key>@sentry.io/<project>',
    // Specify a fixed sample rate:
    'traces_sample_rate' => 0.2,
    // Or provide a custom sampler:
    'traces_sampler' => function (SentryTracingSamplingContext $context): float {
        // return a number between 0 and 1
    }, ]);
Check our documentation for the latest instructions.
See all platformsMore than 150K Organizations Trust Sentry with Their Application Monitoring

PHP Performance Monitoring
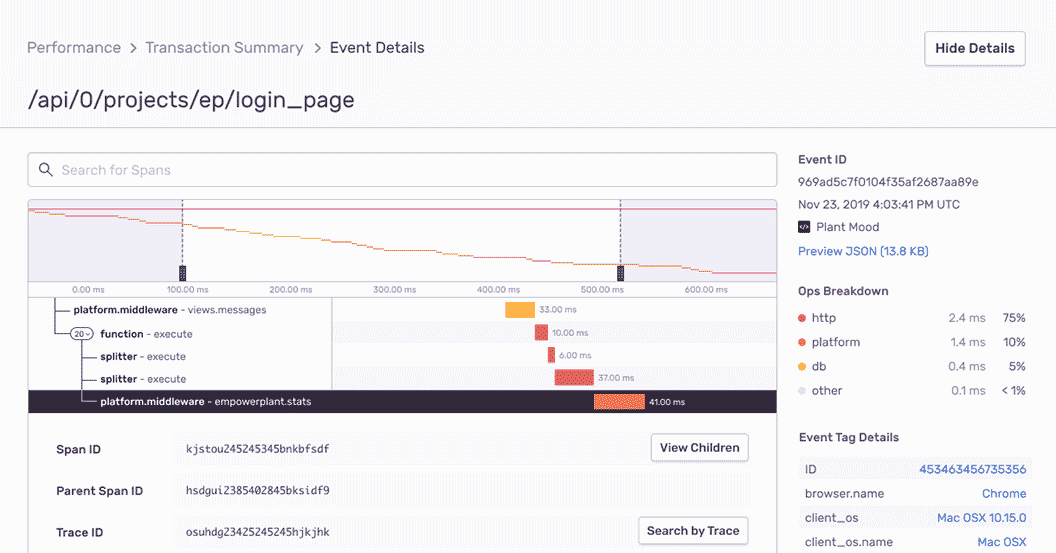
Quickly identify PHP performance issues and view full end-to-end distributed trace to see the exact, poor-performing API call and surface any related errors. Get the real-time data and detailed reporting you need to solve performance issues early.

PHP Error Monitoring with Complete Stack Traces
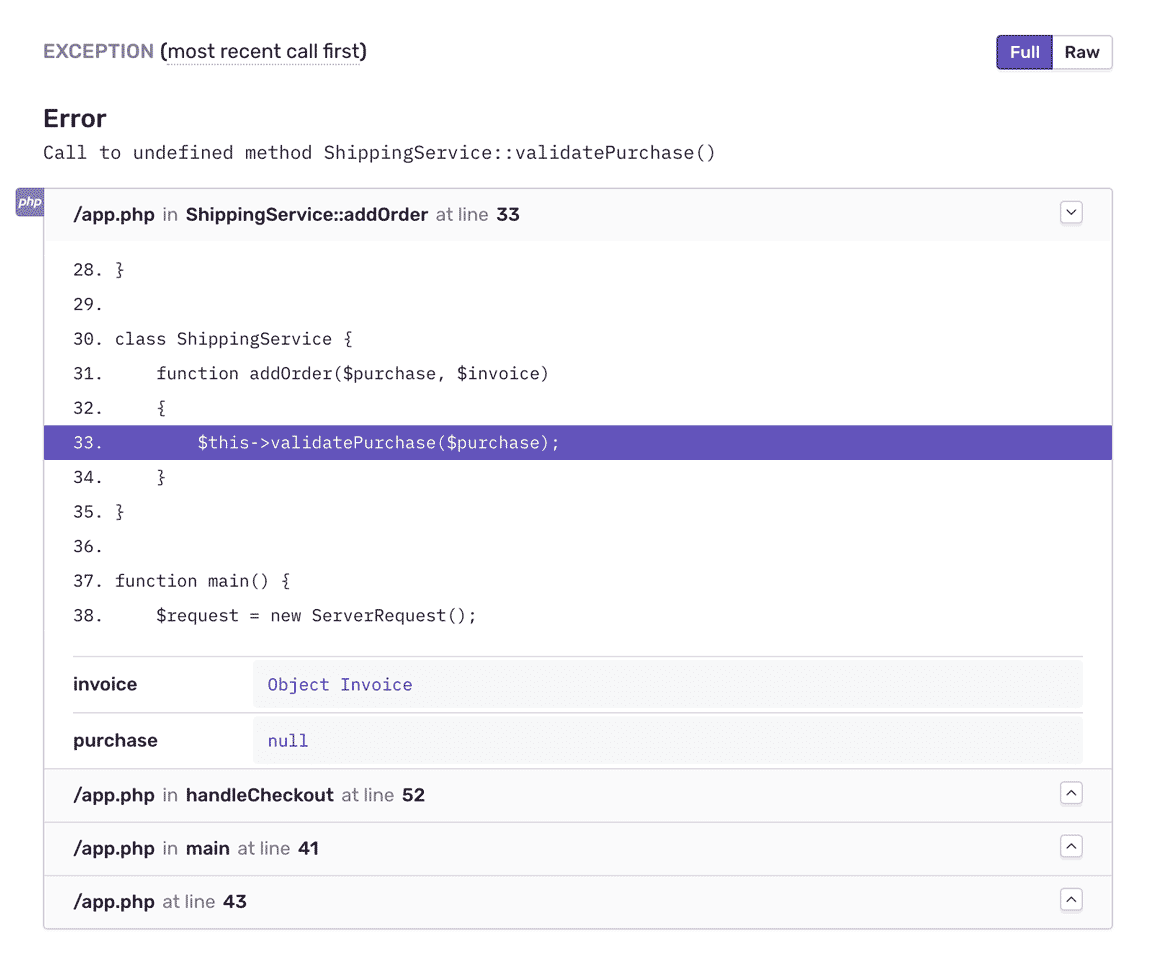
See local variables in the stack for prod errors, just like in your dev environment. Explore the full source code context with frame to function data. Filter and group PHP exceptions intuitively to eliminate noise.

Fill In the Blanks About PHP Errors
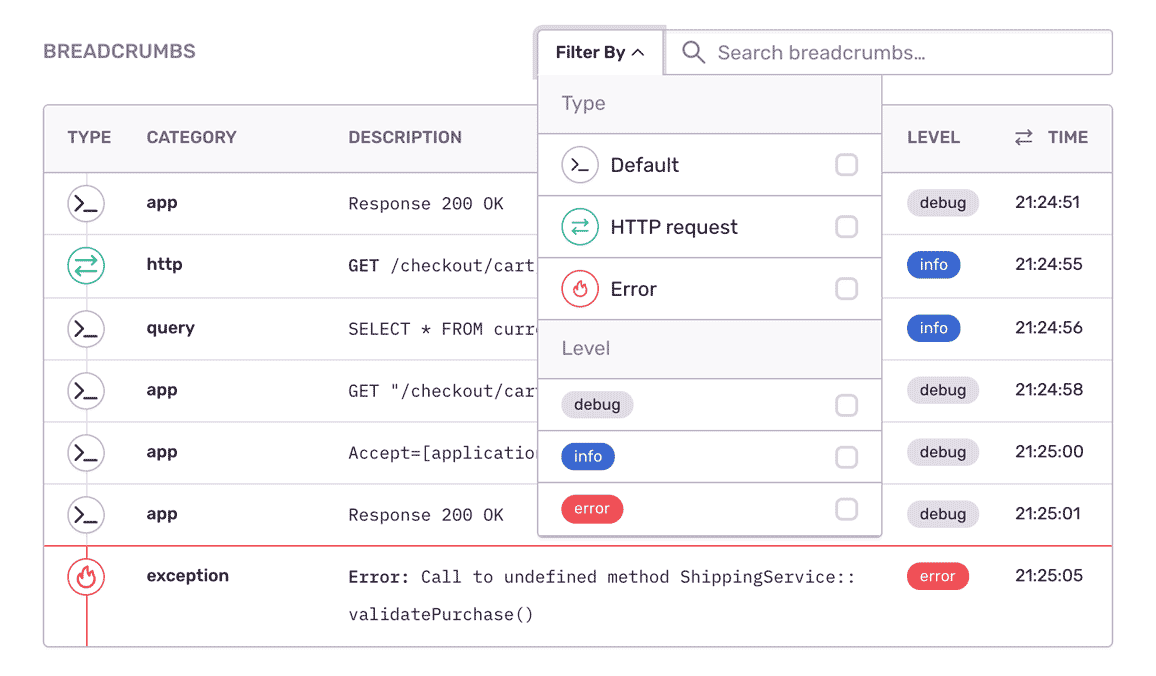
Expose the important events that led to each PHP exception: warnings, past errors, custom breadcrumbs. Get a full view of releases so you can mark errors as resolved and prioritize live issues.
”As we ship code, which we do at least daily, I’m constantly staring at Sentry.”
Debugging Any PHP Exception
Aggregate errors by factors like request details, user ID, and app versions to see what’s new, a priority or a trend.
Assign custom key-value tags to reproduce the error environment specific to your application, business, and users.
Answer the most important questions: How actionable is the error? Can I snooze the alert?