Ember Error and Performance Monitoring
Actionable insights to resolve Ember performance bottlenecks and errors. Improve your monitoring workflow with a full view of releases so you can mark Ember errors as resolved and prioritize live issues.
Getting Started is Simple
Grab the Sentry Ember SDK:
<script src="https://browser.sentry-cdn.com/10.45.0/bundle.min.js"></script>
Configure your DSN:
Sentry.init({
  dsn: 'https://<key>@sentry.io/<project>',
  integrations: [new Sentry.Integrations.Ember()]
});
Check our documentation for the latest instructions.
See all platforms
Ember Performance Monitoring
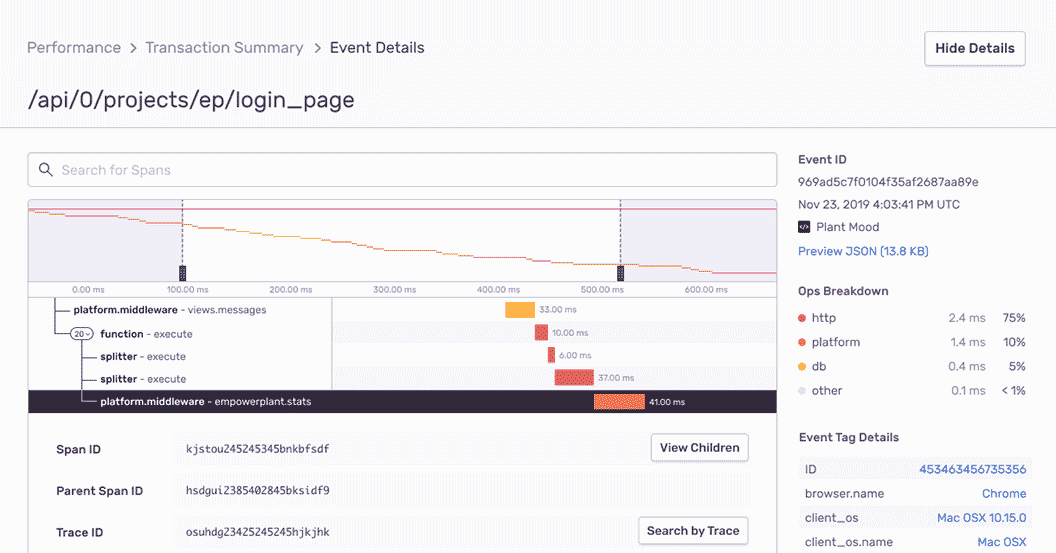
Quickly identify performance issues and view full end-to-end distributed trace to see the exact poor-performing API call and surface any related Ember errors. Improve Ember performance with max efficiency, not max effort.

Ember Error Monitoring With Complete Stack Traces
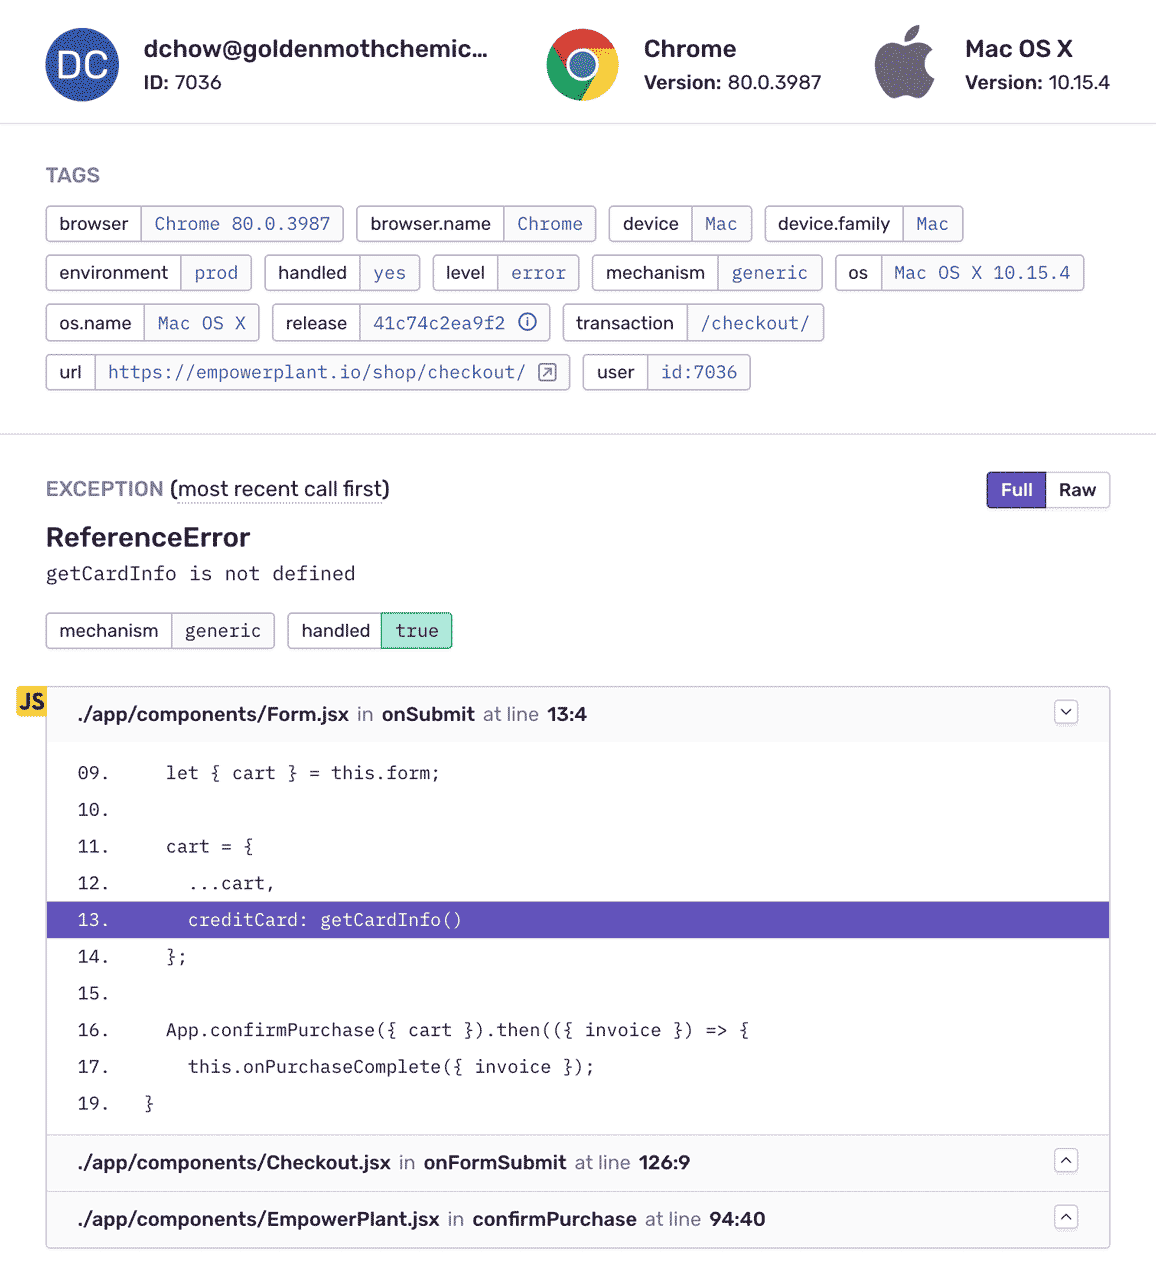
See the error and Ember stack trace previously only visible in your user’s debug console. Apply source maps automatically to convert minified, compiled, or transpiled code back to its original form. Keep your Ember source maps private by uploading them directly to Sentry.

Issues, replayed
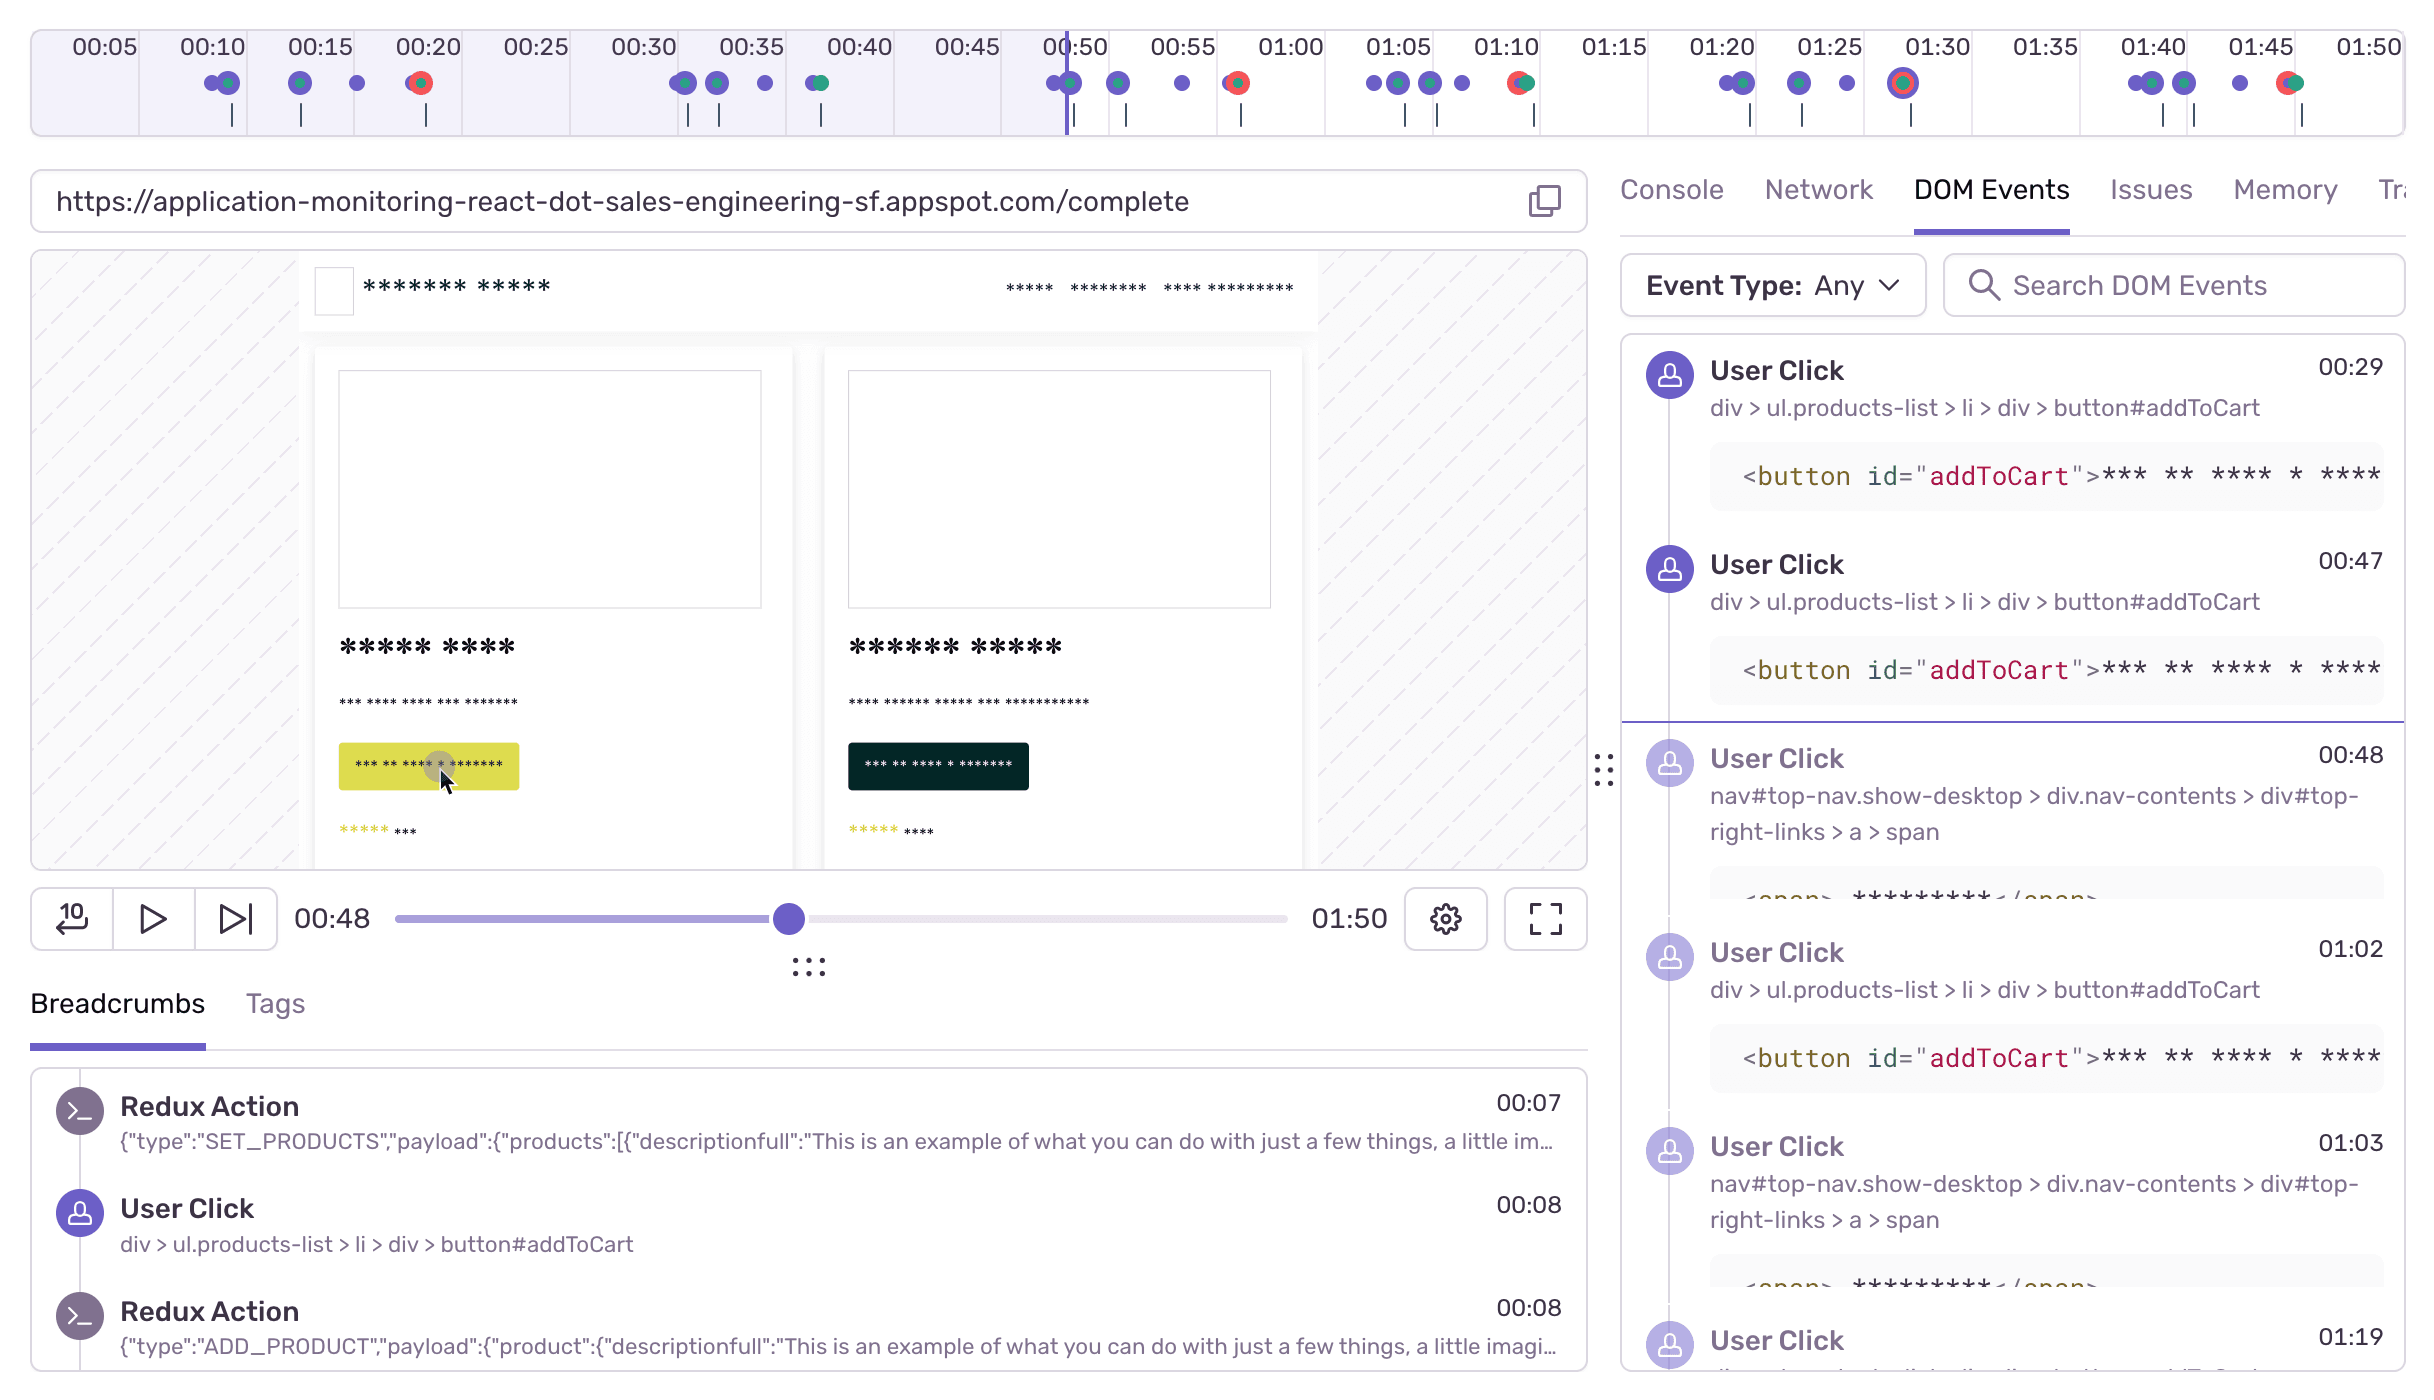
Get to the root cause of an error or latency issue faster with context like DOM events, console logs, and network calls within one visual replay on your web application.
Check out Session Replay
Fill In The Blanks About Ember Errors
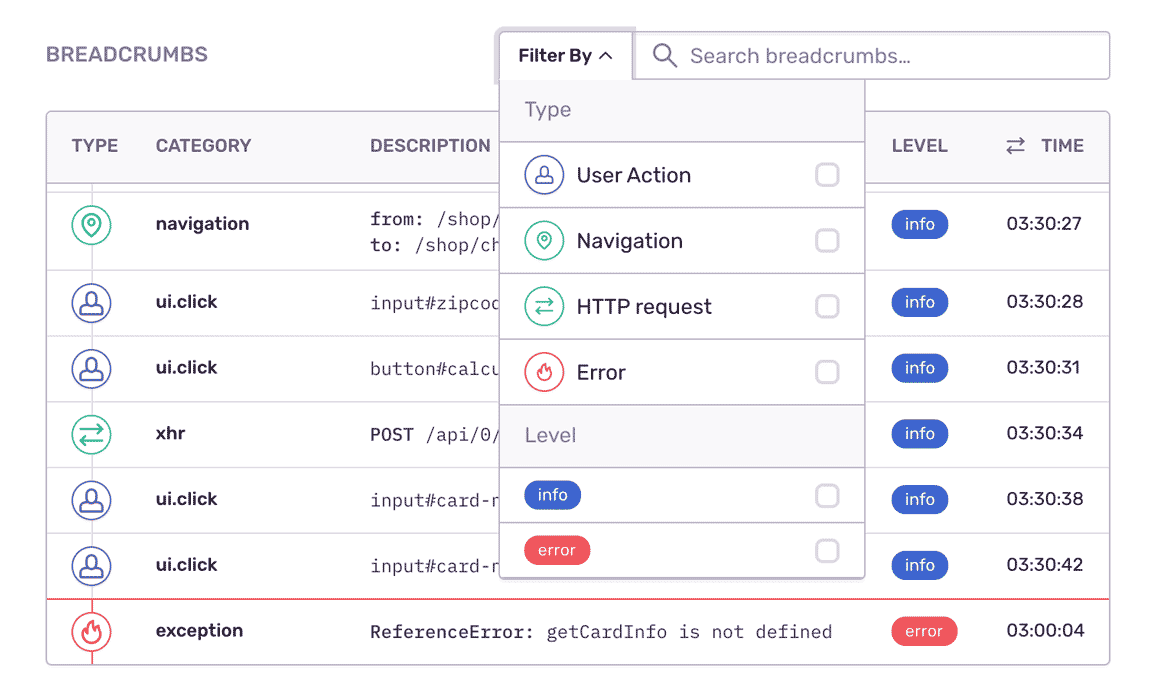
See what the app was doing when the Ember error occurred: user interactions, AJAX requests, console log messages, and more. Learn in which version a bug first appeared, merge duplicates, and know if things regress in a future release
“By correlating Sentry issues to our dev cycle, we can spot where problems begin and how to fix the source.”
See The Full Picture Of Any Ember Exception
Record environment and usage details so you can recreate bugs down to the browser version, OS, and query parameters specific to your app.
Sentry’s tag distribution graph makes it easy to isolate and prioritize any Ember error by seeing how often it occurs in context.
Find answers to key questions: How actionable is this error?Was the bug browser or OS specific?
You can’t afford to put JavaScript monitoring on the backburner.
Even a one-second delay in loading results in a 7% reduction in conversions.
Forty percent of customers abandon a website that takes longer than three seconds to load.
The average cost of downtime is $5,600 per minute — or $300,000 per hour.