Cocoa Error & Performance Monitoring
Sentry automatically captures crashes recorded on macOS, iOS, and tvOS. See Cocoa error details like function, filename, and line number without ever digging through iOS crash logs.
Getting Started is Simple
Just run this command to sign up for and install Sentry.
brew install getsentry/tools/sentry-wizard && sentry-wizard -i ios
Check our documentation for the latest instructions.
See all platforms
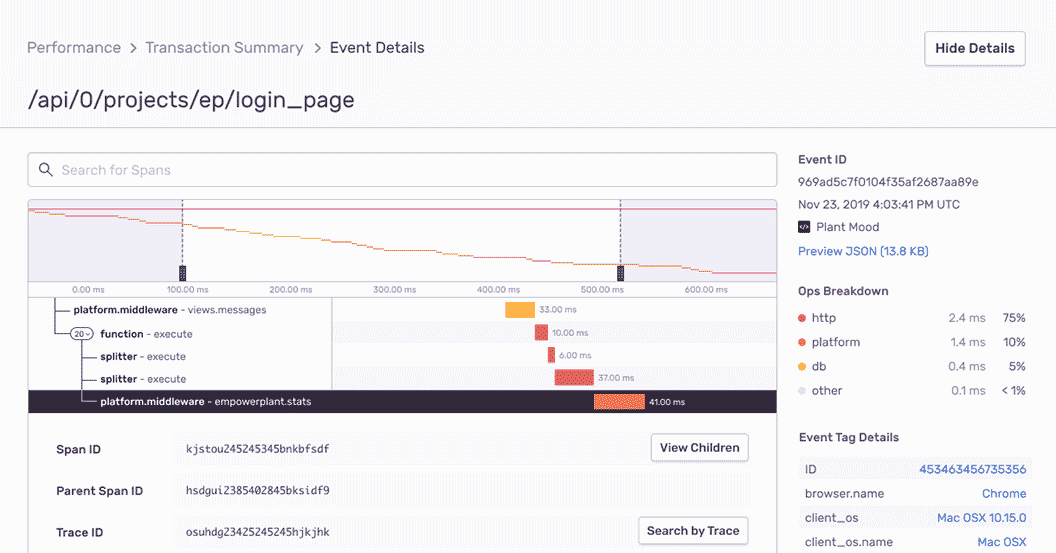
Cocoa Performance Monitoring
Within minutes after installing Sentry, software teams are able to trace Cocoa performance issues back to a poor performing API call as well as surface all related code errors. Engineering Managers and Developers now have a single tool to optimize the performance of their code and deliver fast customer experiences with Performance Monitoring.

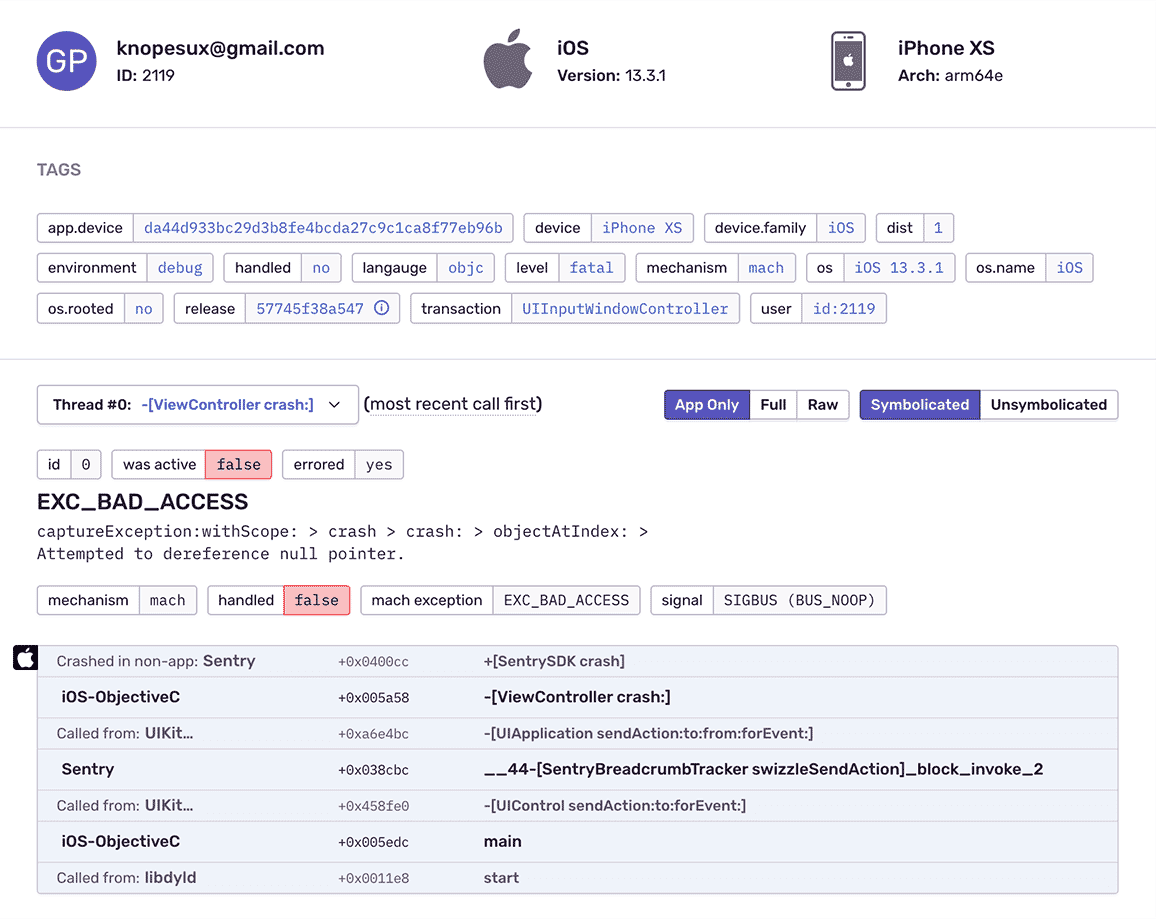
Get iOS Crash Reporting With Complete Stack Traces
Reveal hidden context in Apple’s incomplete crash data by automatically symbolicating unreadable symbols. Handle Cocoa iOS crashes with complete context using the React Native SDK while the Objective-C SDK runs in the background.

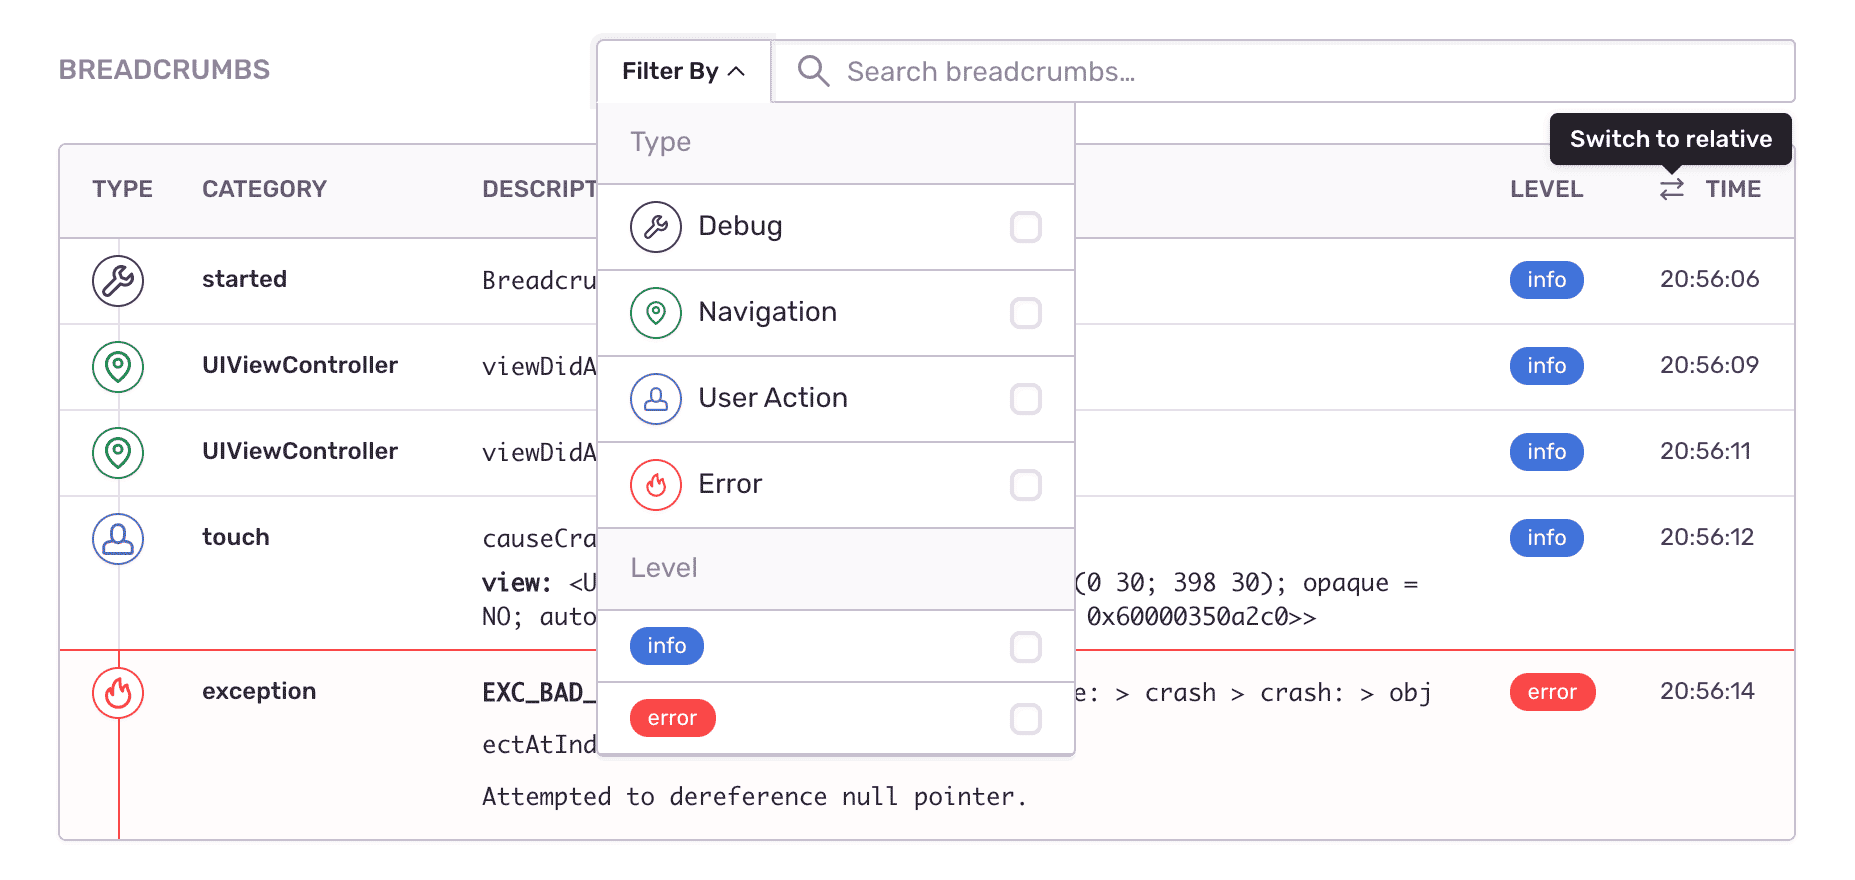
Fill In The Blanks About iOS Crashes
See what the app was doing when the iOS crash occurred: every user action, controller changes, and custom breadcrumbs. Record events when devices are offline or in airplane mode, then send crash reports as soons as connection is regained.

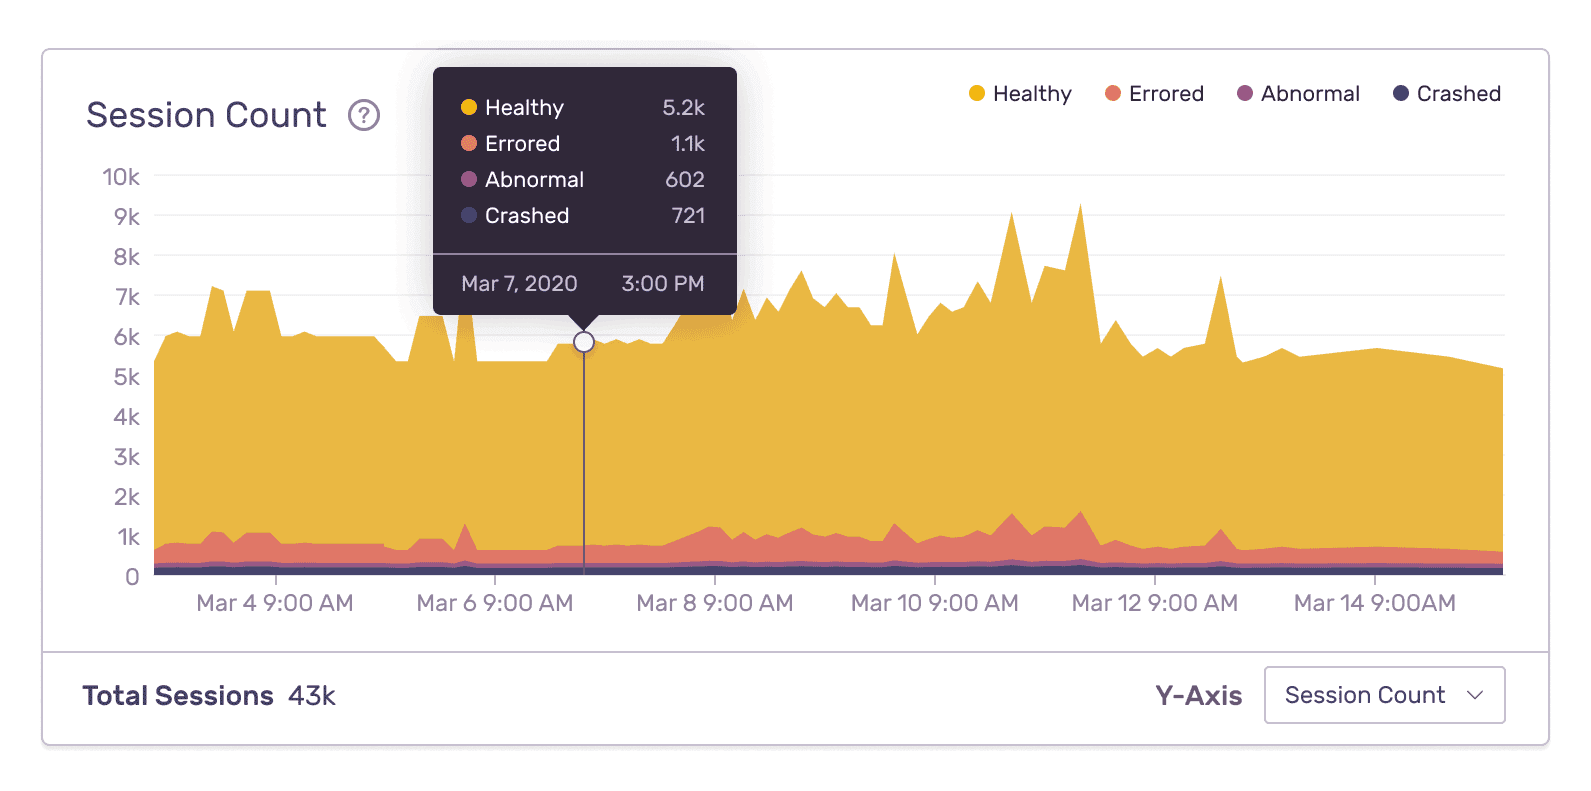
Resolve iOS Crashes With Better Data
Improve Cocoa error monitoring workflow with a full view of releases so you can mark errors as resolved and prioritize live issues. Learn in which version bug first appeared, merge duplicates, and know if things regress in a future release. Add commit data to automatically suggest an owner of each iOS crash and instantly send deploy emails.
“Being able to use Sentry to monitor the performance as well as our mobile applications is important. Using one solution to monitor the entire application stack gives our engineers the visibility they need to deliver a first-rate experience for our customers.”
See The Full Picture Of Any Cocoa Exception
See what the app was doing when the iOS crash occurred
Find answers to the key questions and insights need to resolve the issue
How actionable is this crash? What was the device? Has this same crash occurred before?