Sentry on AWS
Sentry makes monitoring your application health on AWS easier. With support for serverless, microservices, and monolith architectures, Sentry helps you connect the dots from the frontend to the backend so you can identify and solve issues holistically–without the back-and-forth.
Getting Started is Simple
For your serverless apps on AWS, you can automatically add Sentry error and performance monitoring to your Node or Python Lambda functions without changing your code, making it easier for you to get up and running quickly.
Install our Python SDK using pip:
pip install --upgrade sentry-sdk
Then use the AWS Lambda integration for the Python SDK like this:
import sentry_sdk

sentry_sdk.init(
    dsn="https://<key>@sentry.io/<project>",
    integrations=[AwsLambdaIntegration()],
    traces_sample_rate=1.0, # adjust the sample rate in production as needed
)

def my_function(event, context):
    # ...
Check our documentation for the latest instructions.
See all platforms“By integrating Sentry into our client, the visibility we got into what our users were experiencing allowed us to reduce client-side errors by more than 60%.”
More than 150K Organizations Trust Sentry with Their Application Monitoring

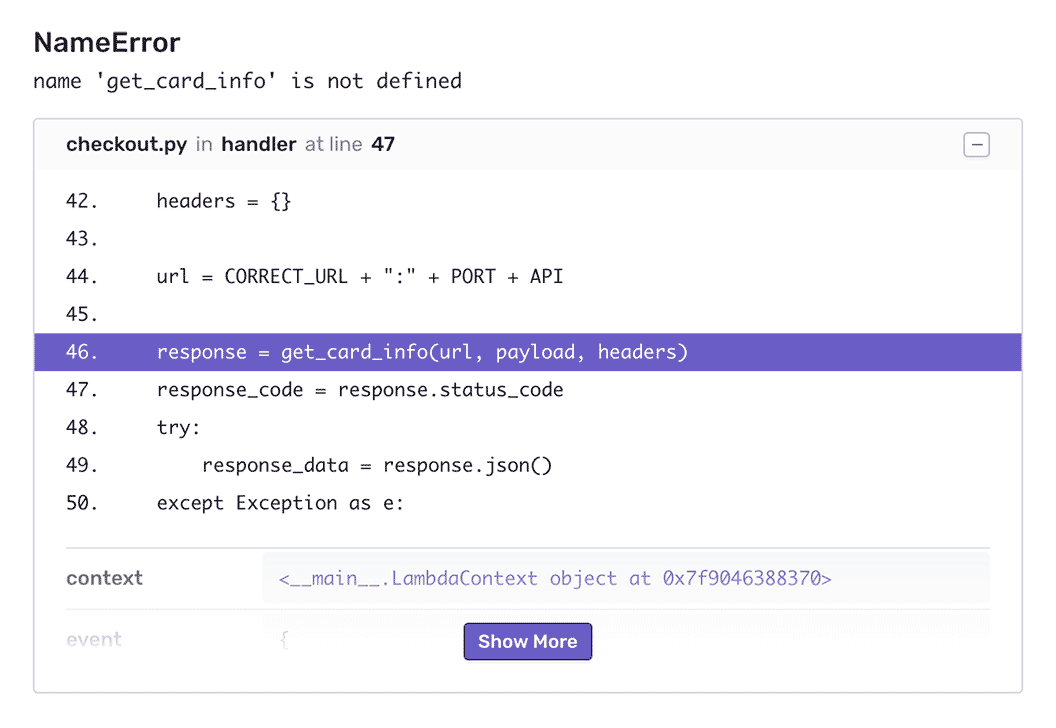
Code-Level Visibility
View stack traces on issues, user-agent information, and all the metadata around an issue for all the context needed to resolve the issue.

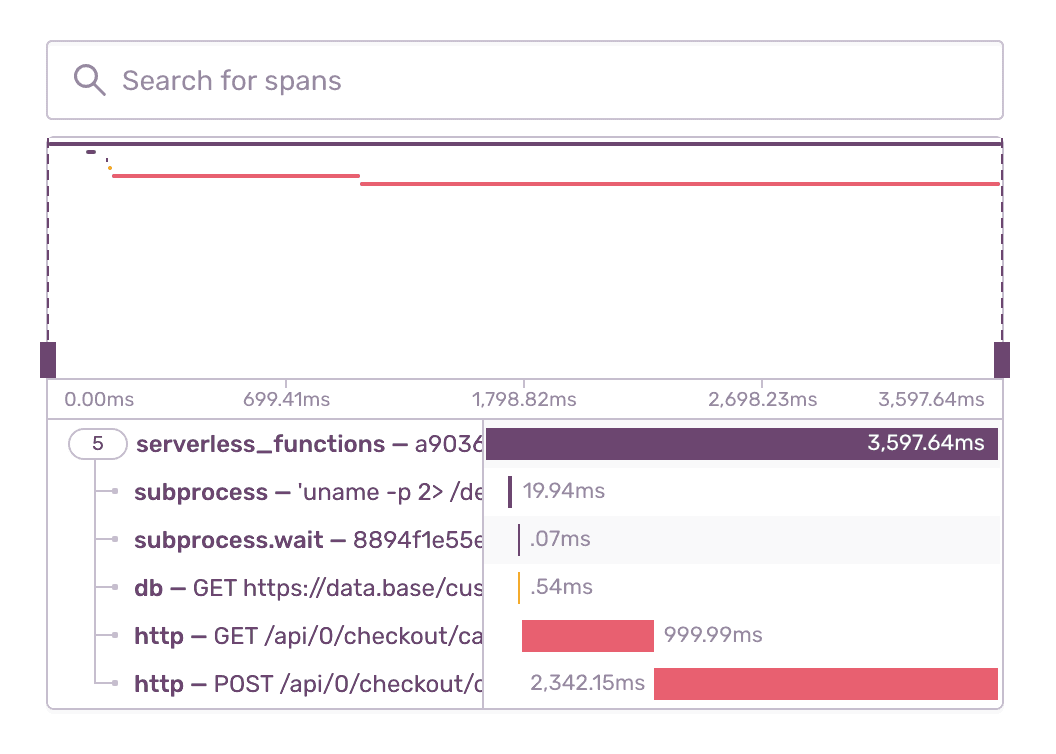
Quickly Identify Function Latencies
Trace those ten-second page loads to poor-performing API calls and slow database queries. The event detail waterfall visually highlights what calls are giving your customers a poor experience.

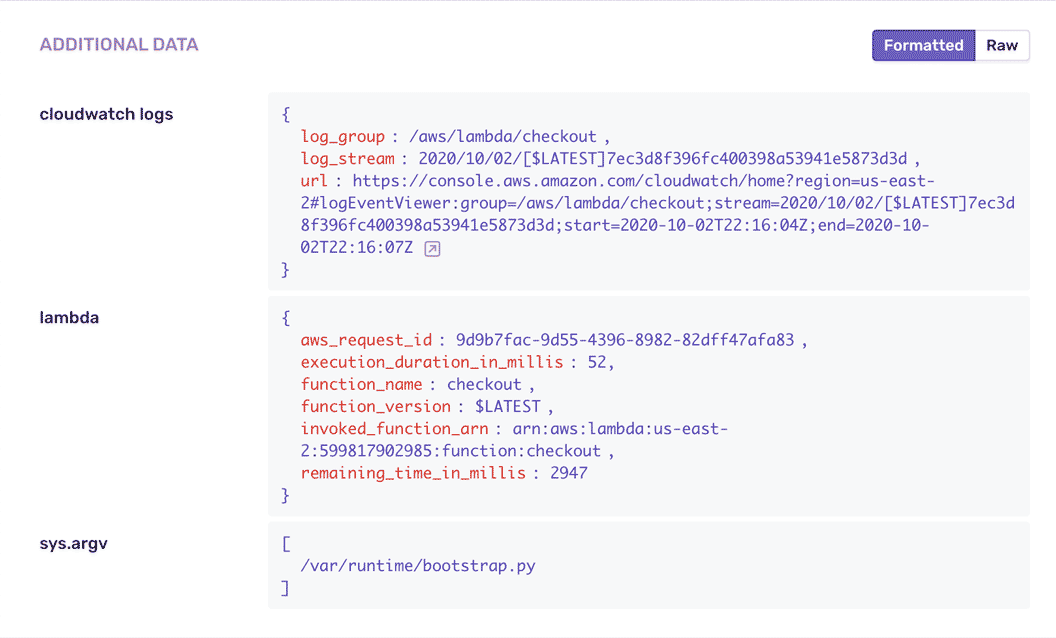
Fill in the Gaps
See what happened leading up to the issue. Get function execution details including function metadata, execution time, Amazon Resource Name, and function identity.

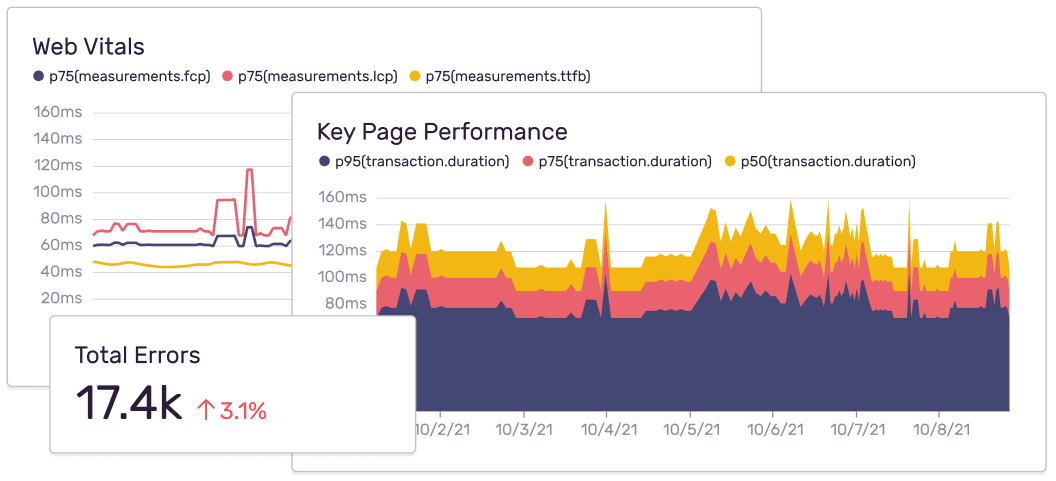
Custom Dashboards and Reporting
Learn from issues and release data to uncover trends and identify opportunities across your entire system .