
Android Crash Reporting and Performance Monitoring
Crush Crashes and ANRs
Get your crash rates to zero (ish) and launch time under a second with Android crash reporting and performance monitoring that won’t let you down. Identify and fix every crash and ANR with real time insights, track and solve performance issues with full stack visibility, and save time with efficient Android error monitoring workflows.
20,000+ mobile teams rely on Sentry for the stability and performance of their mobile apps

Get Started with Jetpack Compose
Jetpack Compose is Android’s recommended toolkit for building native UI. Our integration automatically captures user interactions as breadcrumbs and transactions, so you can quickly understand and solve any related issues.
Read the docs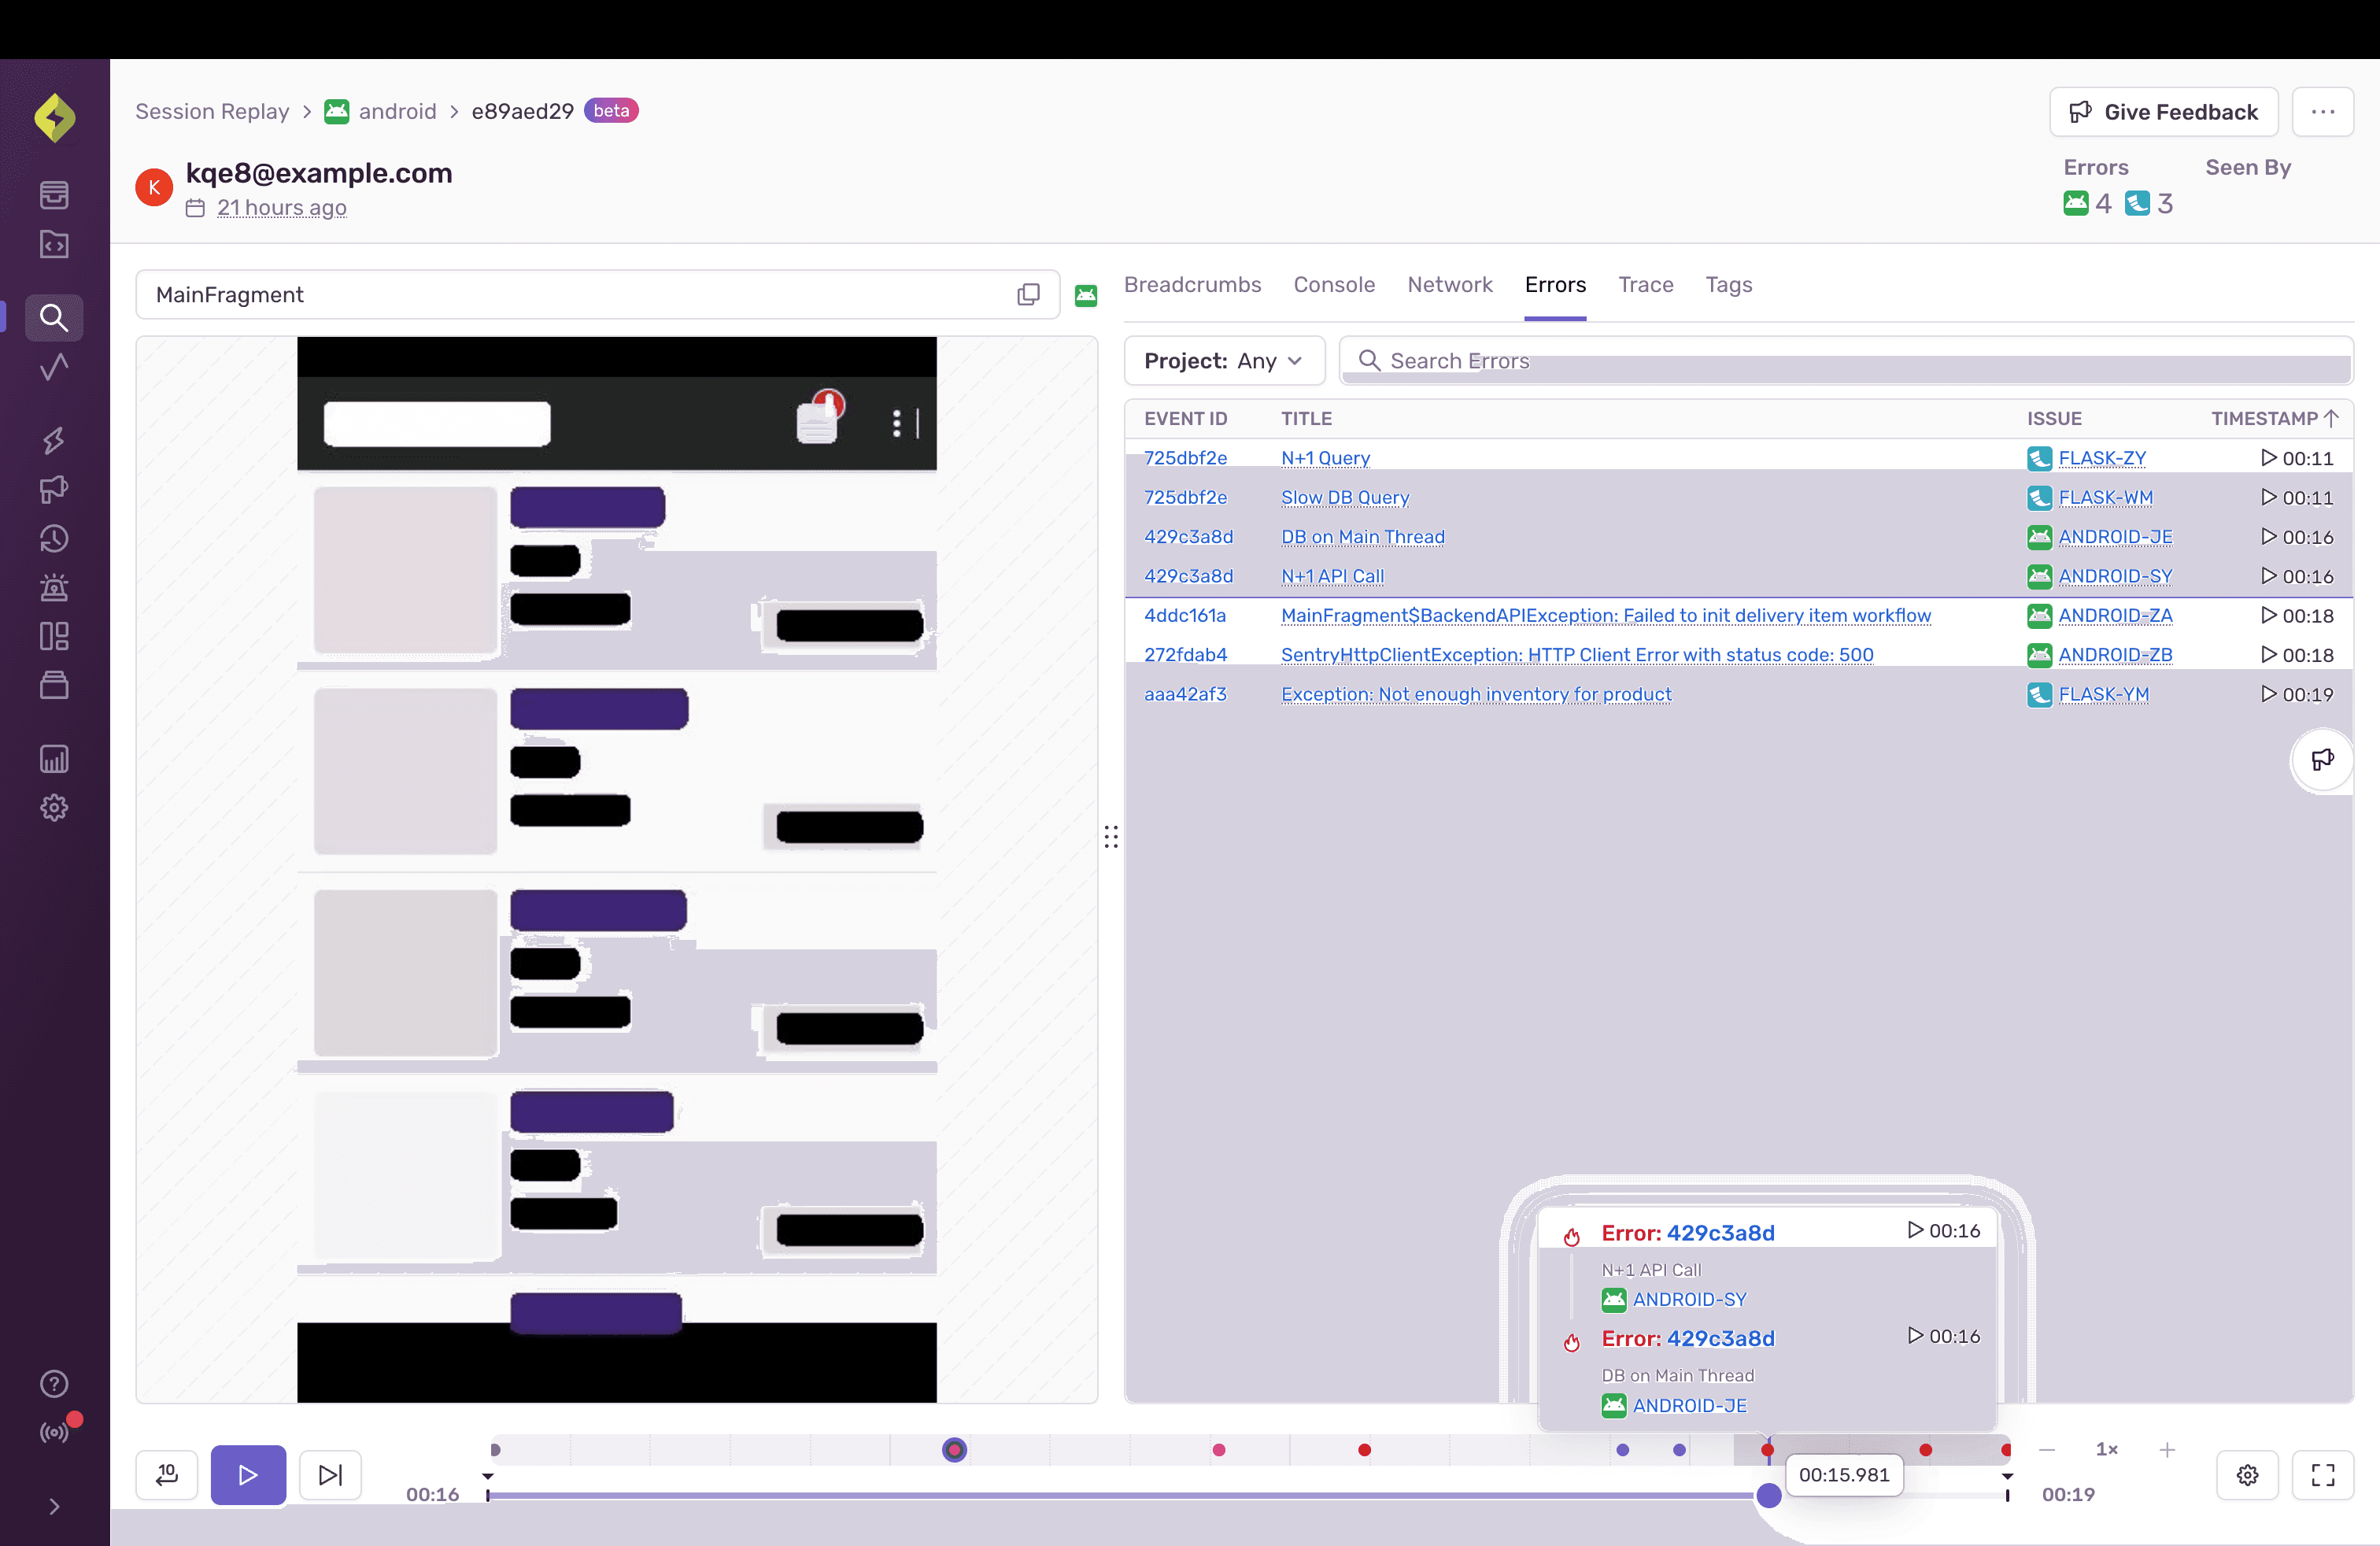
Session Replay
Get to the root cause of an issue faster by watching replays of real user sessions with best-in-class privacy controls. Understand when, where, and how an error is impacting your app without having to repro it yourself, talk to a customer, or expose sensitive data.
Resolve Android Crashes Faster with Deep Insights and Automated Workflows
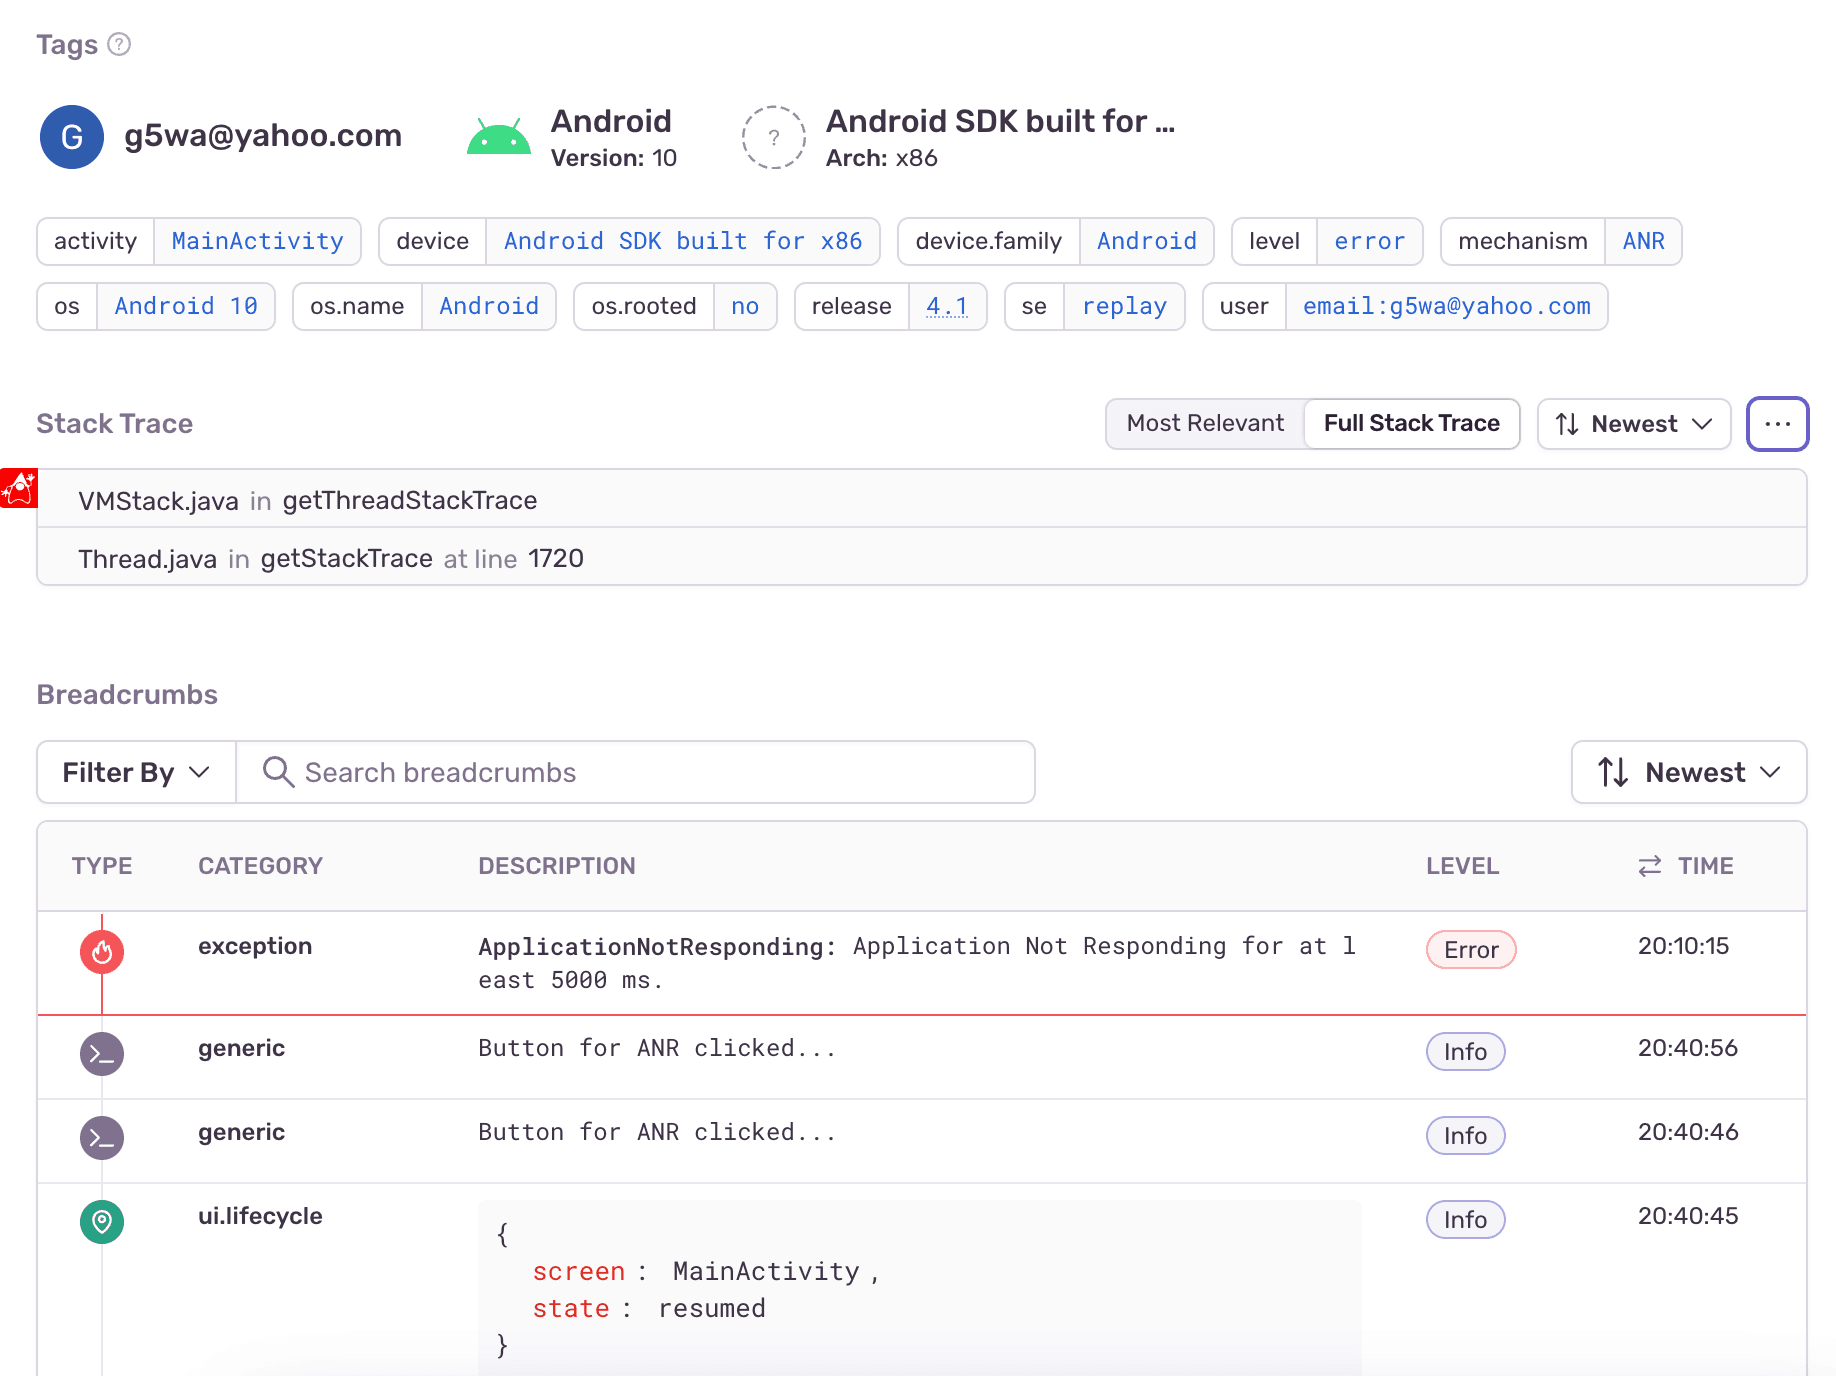
Create customized alerts to take action on crashes and errors before they become widespread. Investigate crashes by device type, OS, and release with actionable, real-time insights, including breadcrumbs, screenshots, stack traces, and suspect commits. Triage and assign issues for fast resolution.
READ ABOUT CRASH REPORTING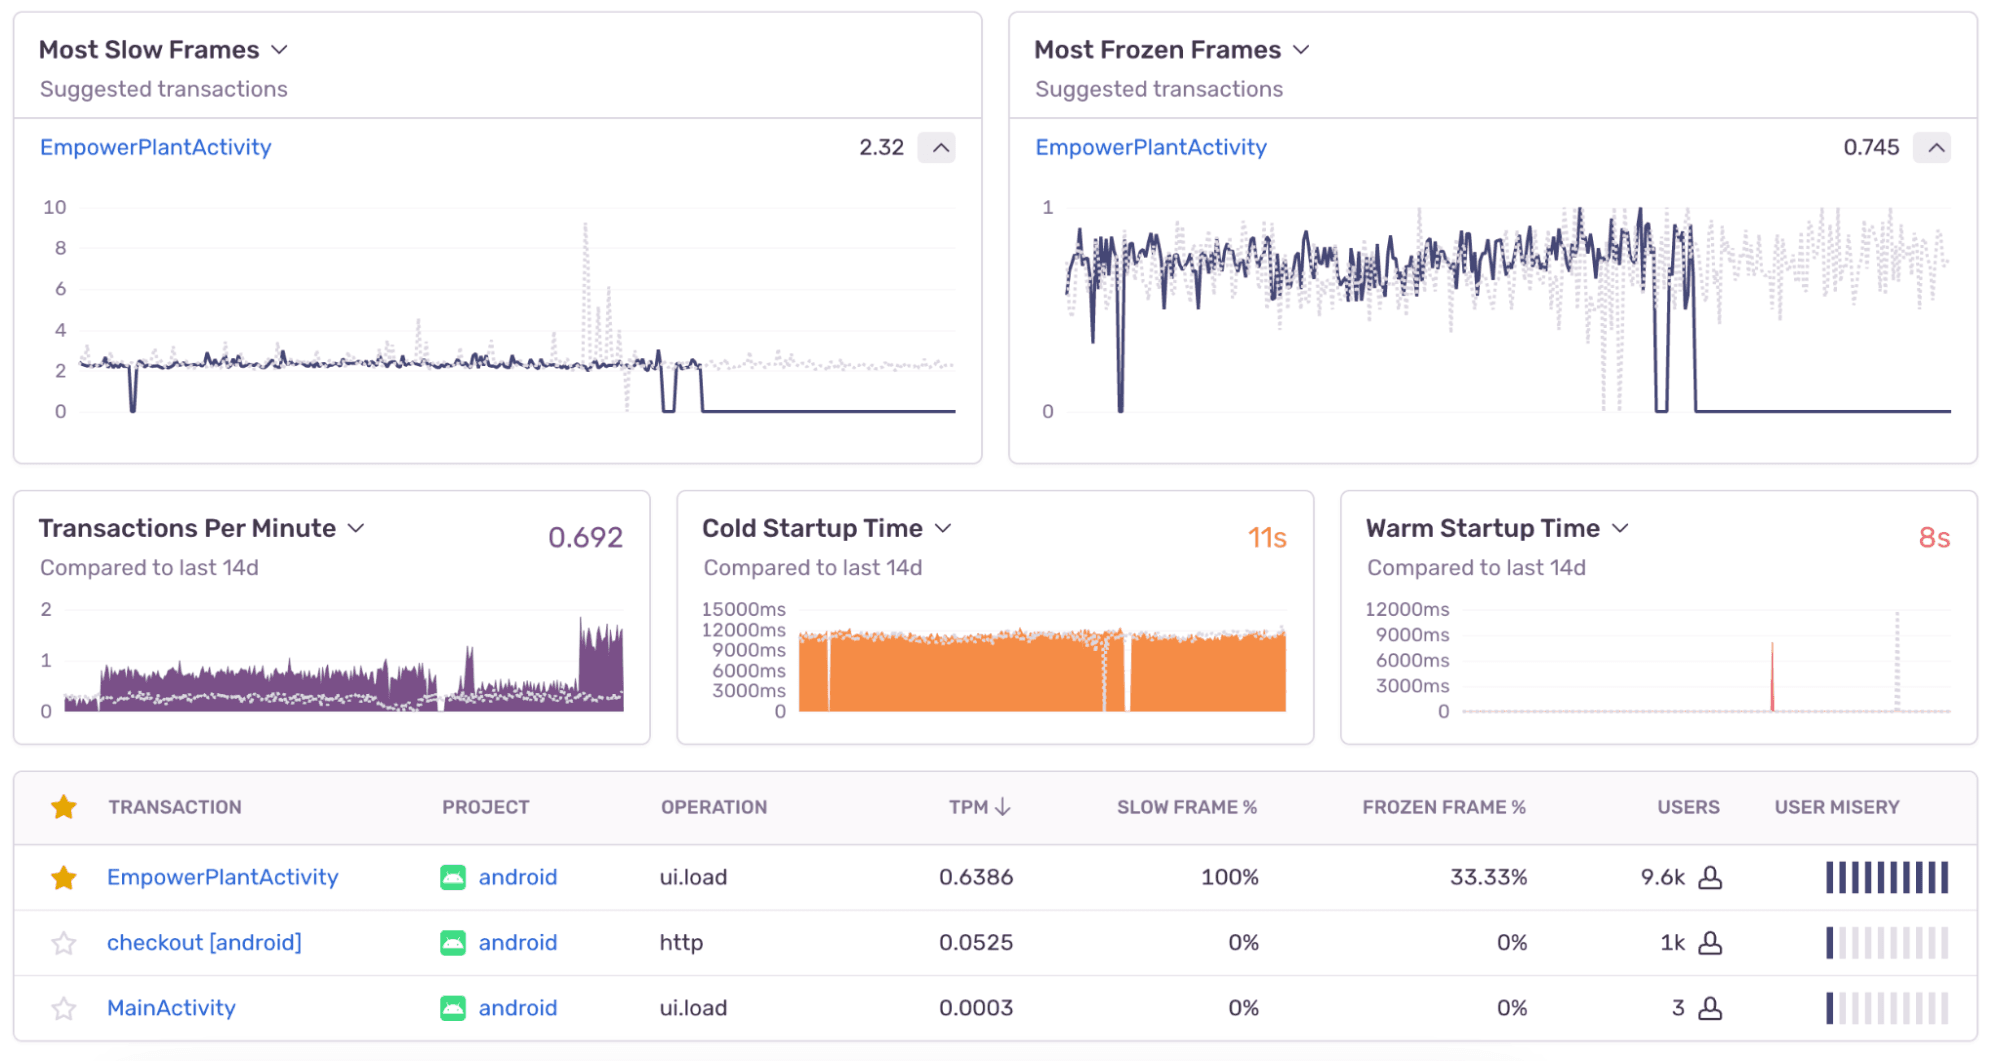
Build Android Apps Worthy of Five Star Reviews
Identify and solve performance issues, like long app start times, ANRs, janky frame rendering, and slow HTTP requests, before they impact your customer experience with Android performance monitoring.
READ ABOUT PERFORMANCE MONITORING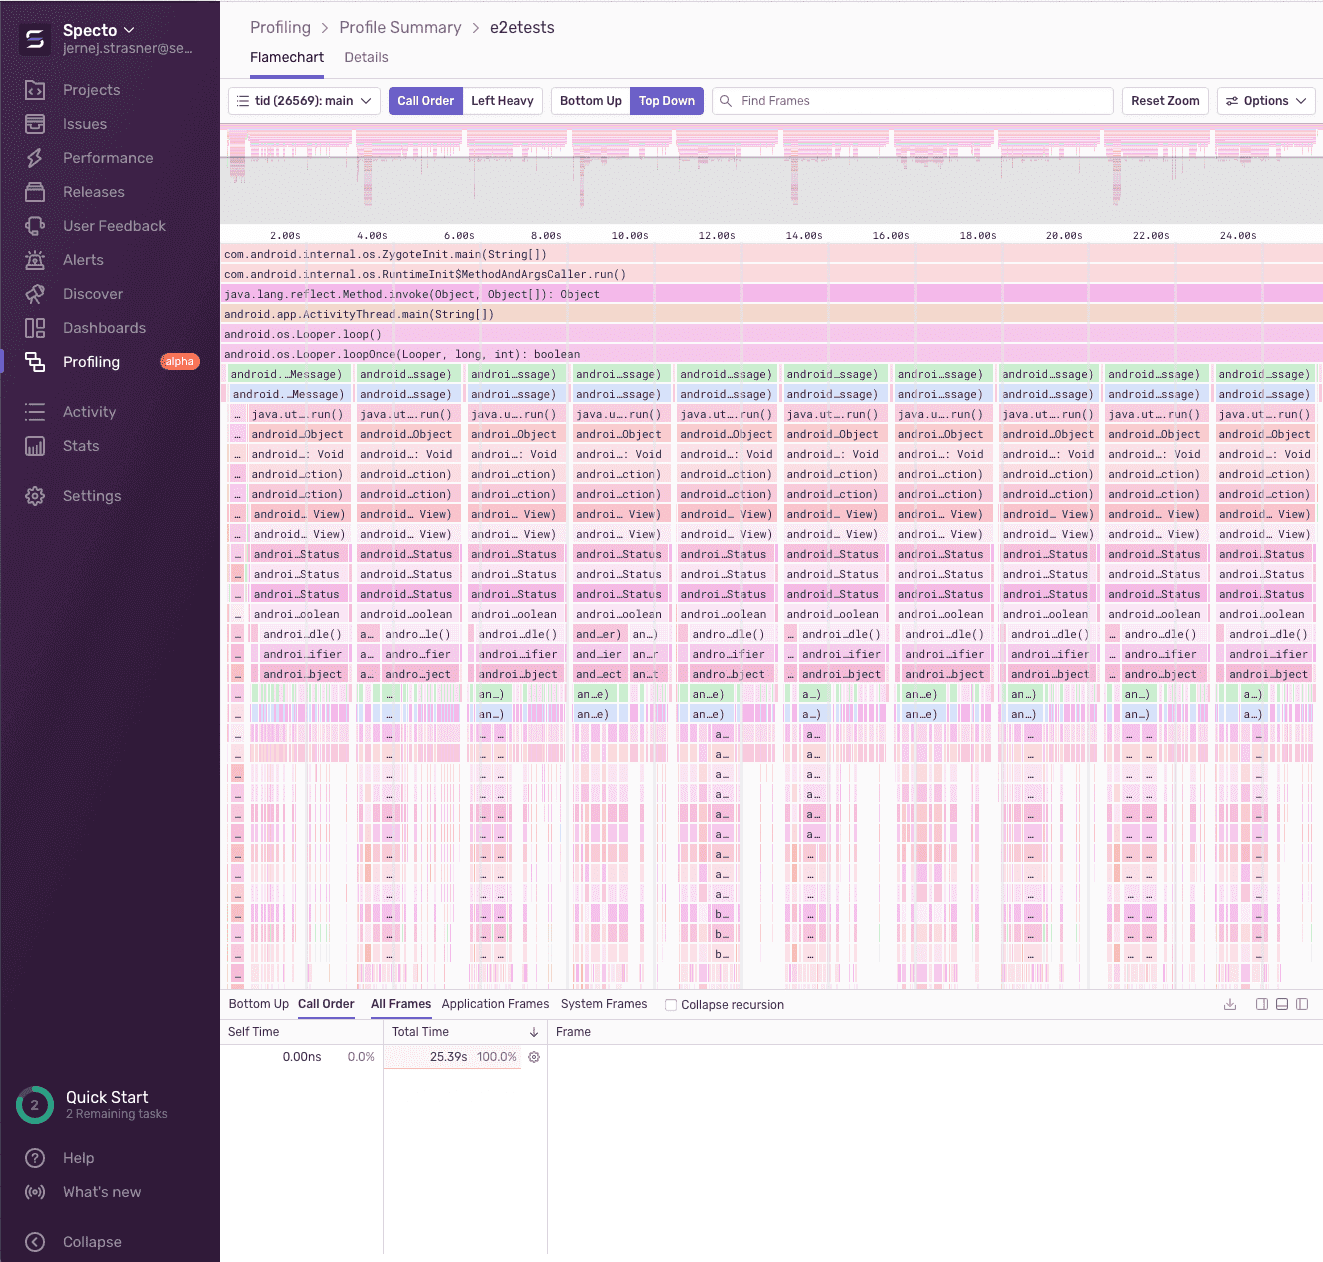
Find and Fix Performance Bottlenecks
Get code-level insight into how your application performs in production environments on real user devices with Profiling. Find the root cause of slowdowns and issues consuming excessive CPU and affecting Android application performance on your user’s mobile device.
READ MORE ABOUT PROFILING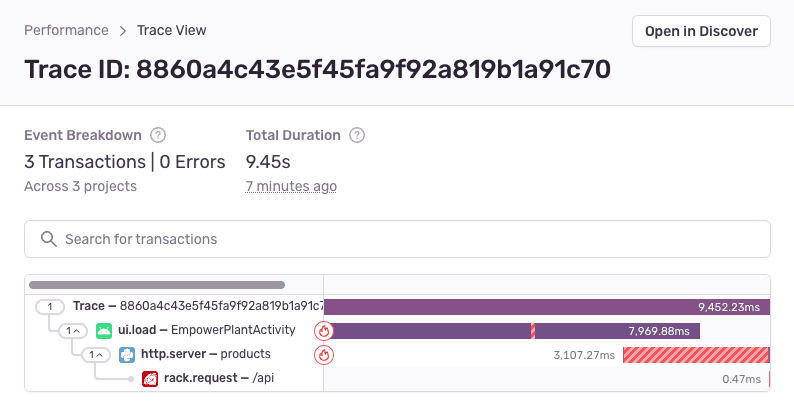
Spend Less Time Fixing and More Time Building
Reduce context switching with a single, centralized platform for Android crash reporting and performance monitoring across projects and clients. With Distributed Tracing, identify backend issues that may affect Android performance, without consulting other tools or engineers.
READ ABOUT DISTRIBUTED TRACING“We were using another popular tool for mobile crash tracking but we wanted to ‘up our game’ and go beyond that. We wanted to capture non-fatal errors in addition to crashes and be set up in a way that we can actually triage and respond to them. We also wanted a better understanding of performance, like screen rendering time. Sentry helped us achieve that.”
Getting Started is Simple
Just run this command to sign up for and install Sentry.
brew install getsentry/tools/sentry-wizard && sentry-wizard -i android
Check our documentation for the latest instructions.
FAQs
Supporting Resources
Get Started in Minutes
Try Sentry for free. Start monitoring and improving the stability and performance of your mobile apps with just a few lines of code.


