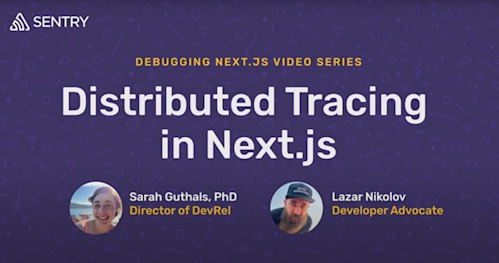
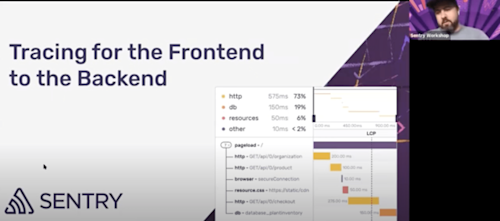
Not sure why that API’s slow? Or where that crash came from? With connected context—from the first user action through every service, system, and line of code—Sentry's distributed tracing gets you to the fix fast, without digging through five different tools.
Distributed tracing — full context for every query, crash, and API call
Debug with Tracing
More questions answered
How can I catch slowdowns before users do?
Set metric alerts on latency, error rate, or throughput for key spans like payment.stripe.charge. For dynamic patterns, use anomaly alerts to detect spikes or regressions without thresholds. Then jump into trace waterfalls to find the exact cause.
Why is this endpoint slower after the last deploy?
Sentry surfaces performance issues like N+1 queries, slow database calls, and uncompressed assets. Each issue includes example traces, spans, and stack traces to show where time is spent. Quickly identify root causes—whether it’s inefficient code, blocking I/O, or frontend bottlenecks.
Is this database call getting slower over time?
Use span metrics to track latency, throughput, and failure rate for specific operations like db.query.user_by_id. Analyze trends over time, broken down by service, operation, or environment. Use filters to investigate performance regressions and set alerts on critical spans.
How to debug errors in background jobs?
With Sentry tracing, background jobs are part of the full request flow—so you can see what triggered them, how long they ran, and where they failed. Spans show job timing, retries, and related service calls. When a job errors, trace context connects it to user actions or upstream issues
What’s causing errors in my agent runs?
Monitor and debug AI agents like OpenAI and Vercel with full visibility into how they interact with your app. See prompt flows, model responses, and tool calls. Catch failures in tools, malformed outputs, or high token usage. Link issues to triggering frontend/backend requests to understand impact.




Getting started with Sentry is simple
We support every technology (except the ones we don't).
Get started with just a few lines of code.
import * as Sentry from '@sentry/nextjs'; Sentry.init({ dsn: 'https://[email protected]/0', // We recommend adjusting this value in production, or using `tracesSampler` // for finer control tracesSampleRate: 1.0, });
That's it. Check out our documentation to ensure you have the latest instructions.
Distributed tracing FAQs
Of course we have more content
Get monthly product updates from Sentry
Sign up for our newsletter.
Sign up for our newsletter.
And yes, it really is monthly. Ok, maybe the occasional twice a month, but for sure not like one of those daily ones that you just tune out after a while.
Fix It
Get started with the only application monitoring platform that empowers developers to fix application problems without compromising on velocity.
