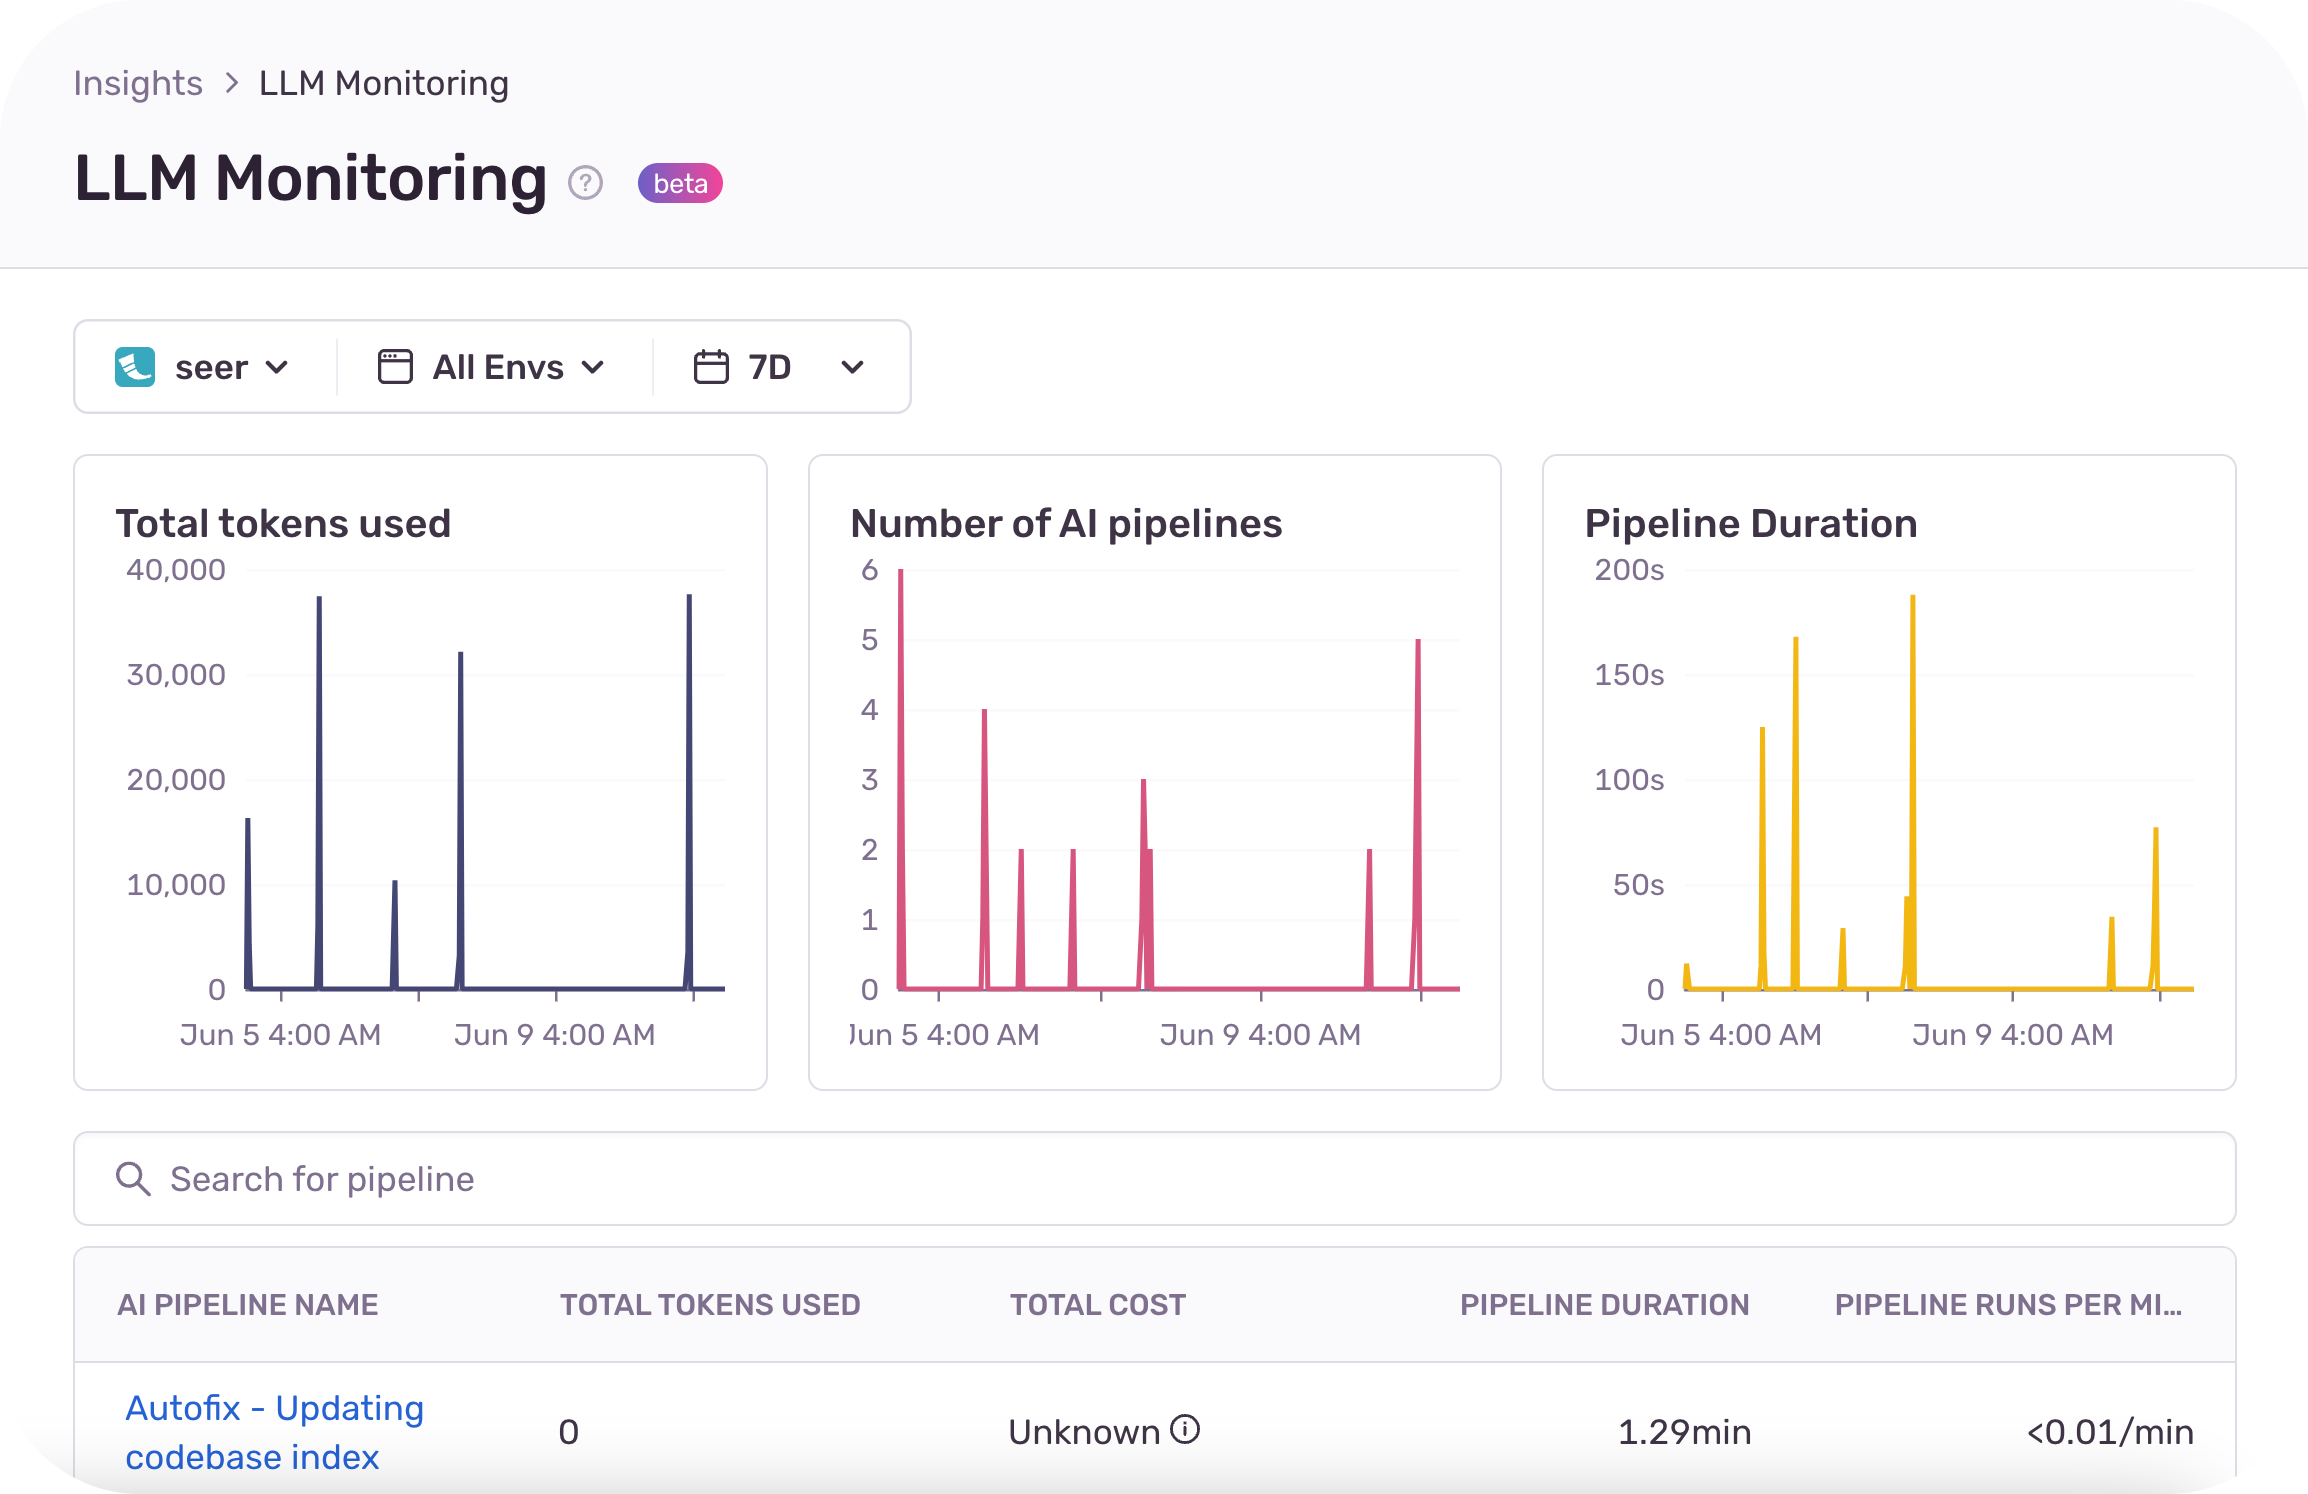
Sentry LLM Monitoring offers organizations rich debugging context, and visibility into the cost and performance of applications calling LLMs. Developers get better visibility into their LLM-powered applications with automatic token cost and usage calculations for their LLMs. Developers can identify the root cause of an issue fast with detailed debugging context, like the model version, user prompts, and the sequence of calls to the LLM. With real-time visibility into errors, performance bottlenecks and cost, organizations can make their LLM-powered applications more effective and efficient.

Sentry LLM Monitoring is for you if:
Core Features
Getting started
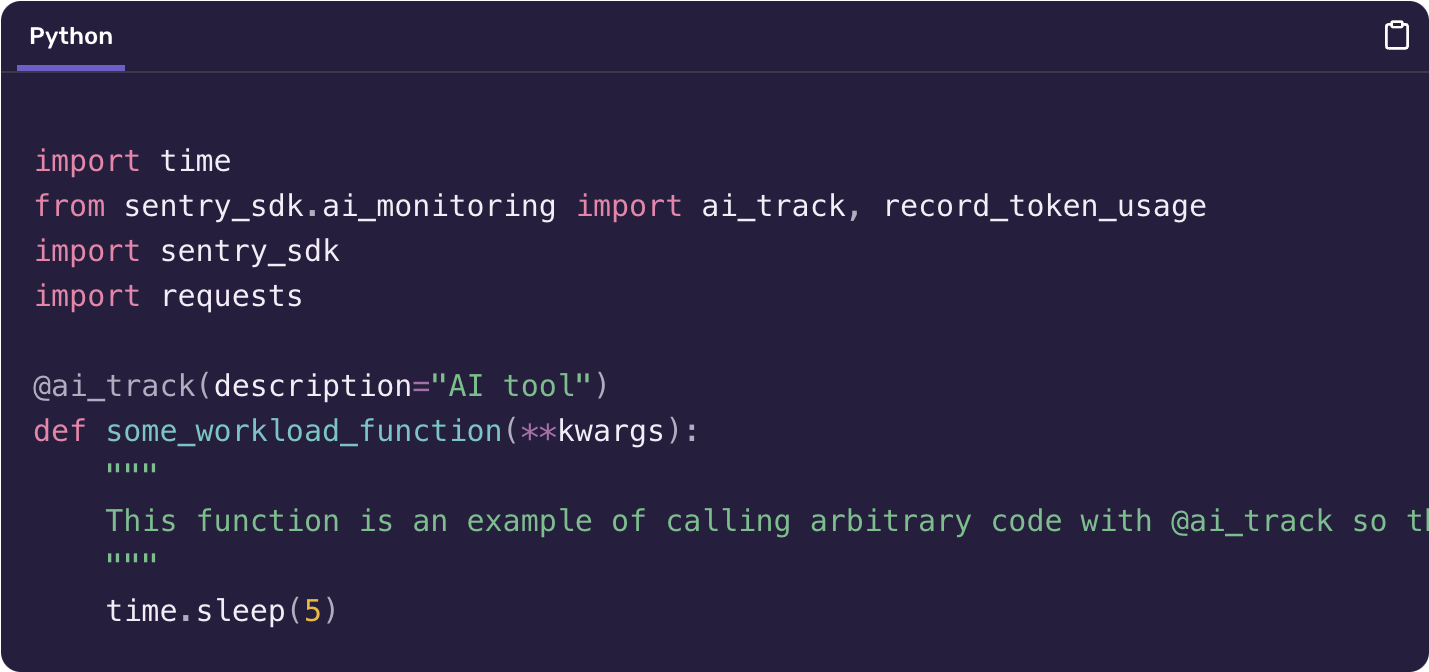
Sentry LLM Monitoring is automatically enabled for users of the Sentry Python SDK. You can also use our provided decorators to manually create AI pipelines and store token usage information.

You'll need:
@ai_track that calls one or more LLMs.